
I currently do have NetFlow traffic monitoring at home. But how? By day, I am a lead site reliability engineer in a global cybersecurity company. By night, I monitor my home with Zabbix & Grafana and do some weird experiments with them.
I have an ASUS RT-AX68U router at home. It supports Asuswrt-Merlin custom firmware, so of course I have that installed. It supports all kinds of custom modules from adblocking to better firewalls to traffic statistics ... and some time last December I realised that it also has a command line package manager, via which I found out softflowd.
Hello, ElastiFlow
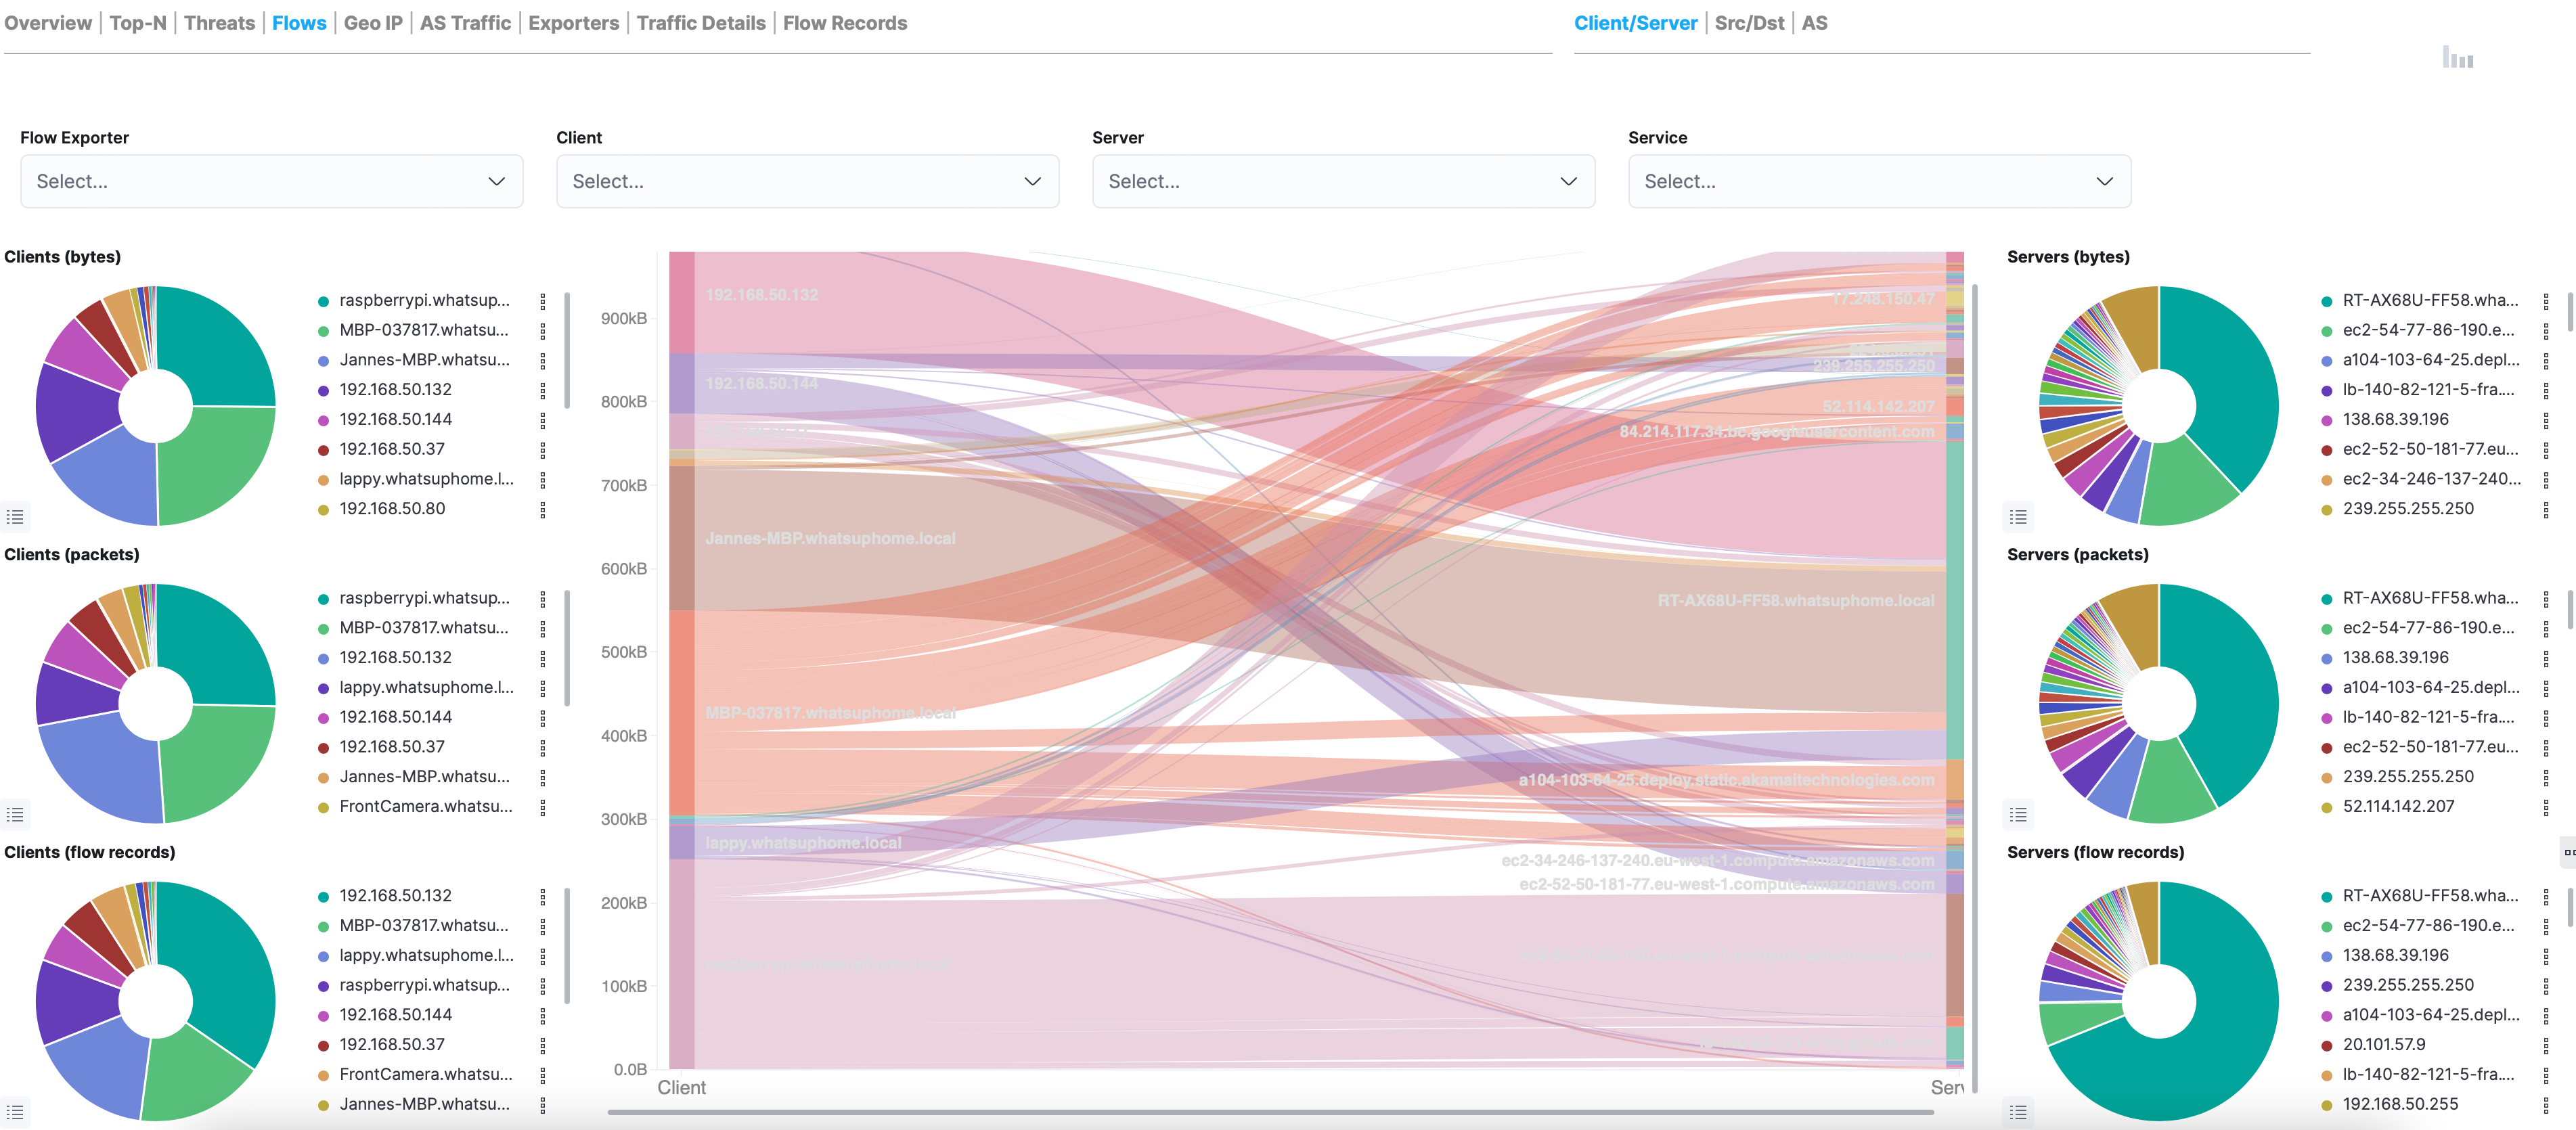
I have some previous experience with ElastiFlow from several years ago. It's basically "just" a bunch of Logstash rules and pre-made dashboards for Kibana, plus some Elasticsearch modules to read the NetFlow/IPFIX traffic.
So, I installed ELK stack and ElastiFlow legacy version to my secondary laptop. After that I pointed my Asus router to send its NetFlow traffic to my Elasticsearch instance with
softflowd -i br0 -n 192.168.50.29:2055 -D
Next I waited. And waited. It felt like an eternity, but in a wall-clock time maximum of few minutes later data started to appear on my fresh ElastiFlow instance. And it works!

Show NetFlow in Grafana
Grafana has a native Elasticsearch plugin, so I took that into use by pointing it to my fresh Elasticsearch instance and its ElastiFlow index.

So, now I can easily do all kinds of NetFlow dashboards in my Grafana, too, such as showing the top geographical locations of the servers where our network devices connect to.

Where's Zabbix?
I did this setup originally already back in December, and ever since have been poking Zabbix for NetFlow support. I'm currently already able to connect to my Elasticsearch via Zabbix and fetch the values.

I'm currently figuring out what would be the best way for me to make this work smoothly in Zabbix. Maybe a small custom module, now that I understood that from Zabbix 6.4 those are even easier to create? Some LLD magic? I'm open to suggestions!
I have been working at Forcepoint since 2014 and monitoring data makes my life flow.
