
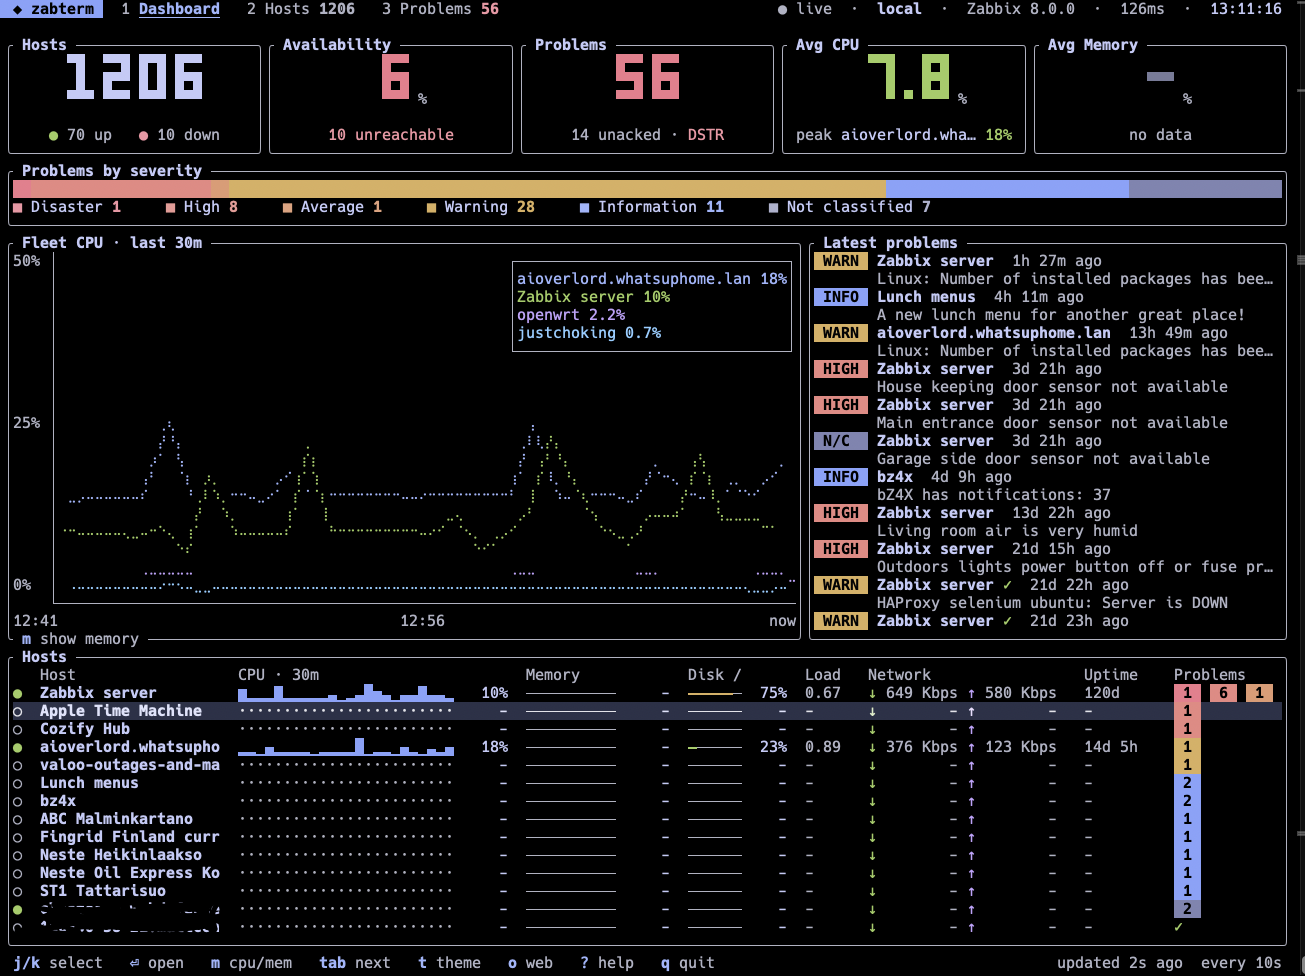
We have all been there. We are doing something very intensive inside our tmux, herdr, any other console tool. Suddenly you get an alert from Zabbix and you'd like to investigate it further. At that point, switching from console to web browser just feels wrong and bursts your focus bubble. Or maybe you just live inside terminals and avoid using GUIs whenever possible. There's now a solution, which is this new guy in town: Zabterm.
Overview dashboard
Look, isn't it gorgeous? If you are wondering the host count of my home Zabbix, that's just an artifact of one of my experiments with darkstat, more about that later… maybe.
Host dashboards
For any individual host, you get to inspect much of the same you can do through regular Zabbix UI. I don't know why the memory isn't showing for my hosts, maybe an early version bug or incompatibility with Zabbix 8.0beta2? Anyway, just a minor blip.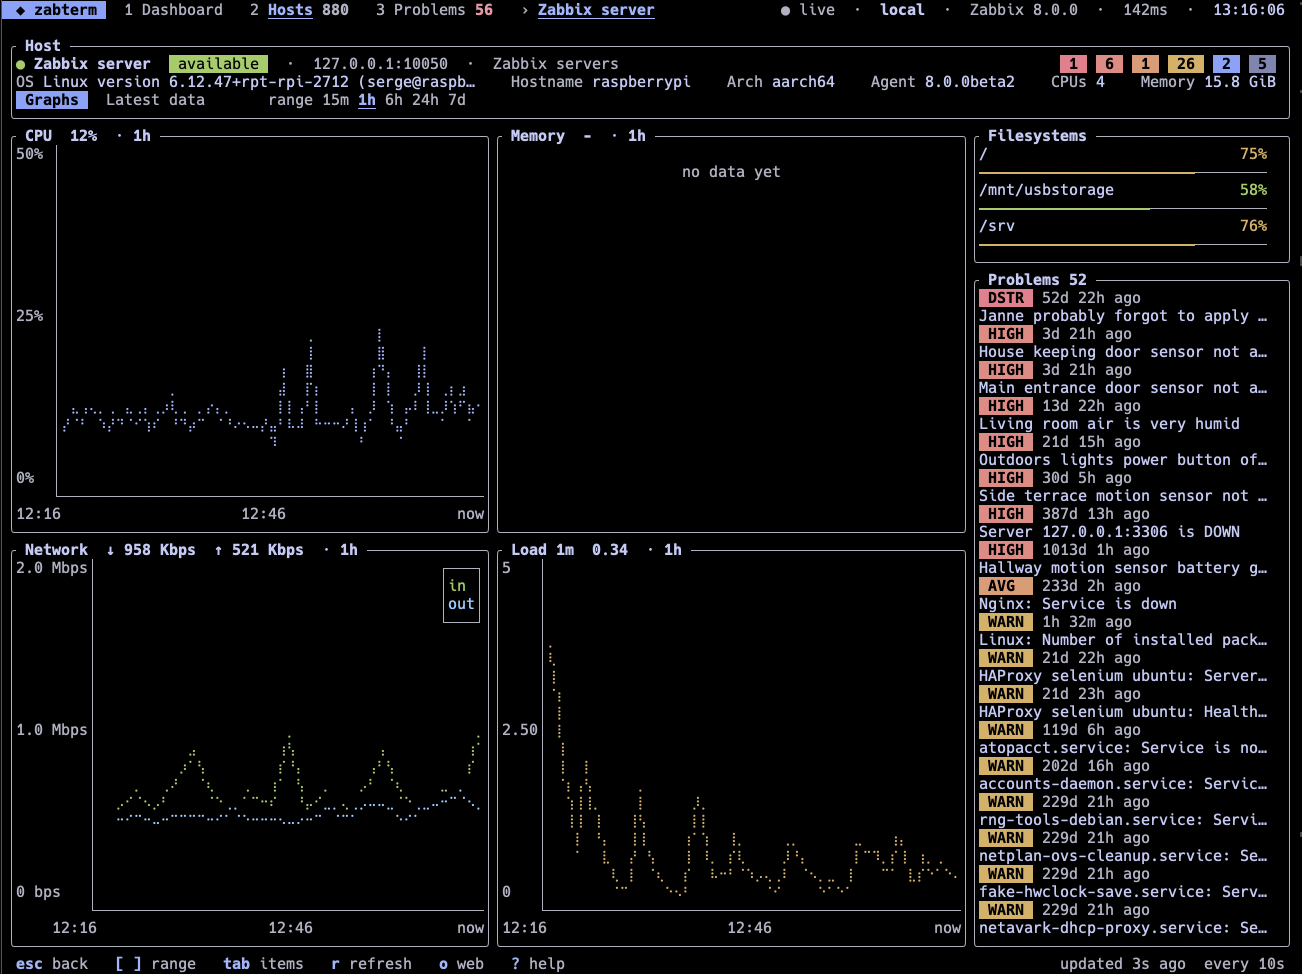
Acknowledge problems fast
In Problems view, you get to see the active problems. What I particularly like is that you can quickly acknowledge a problem by pressing a and then just type your ack message.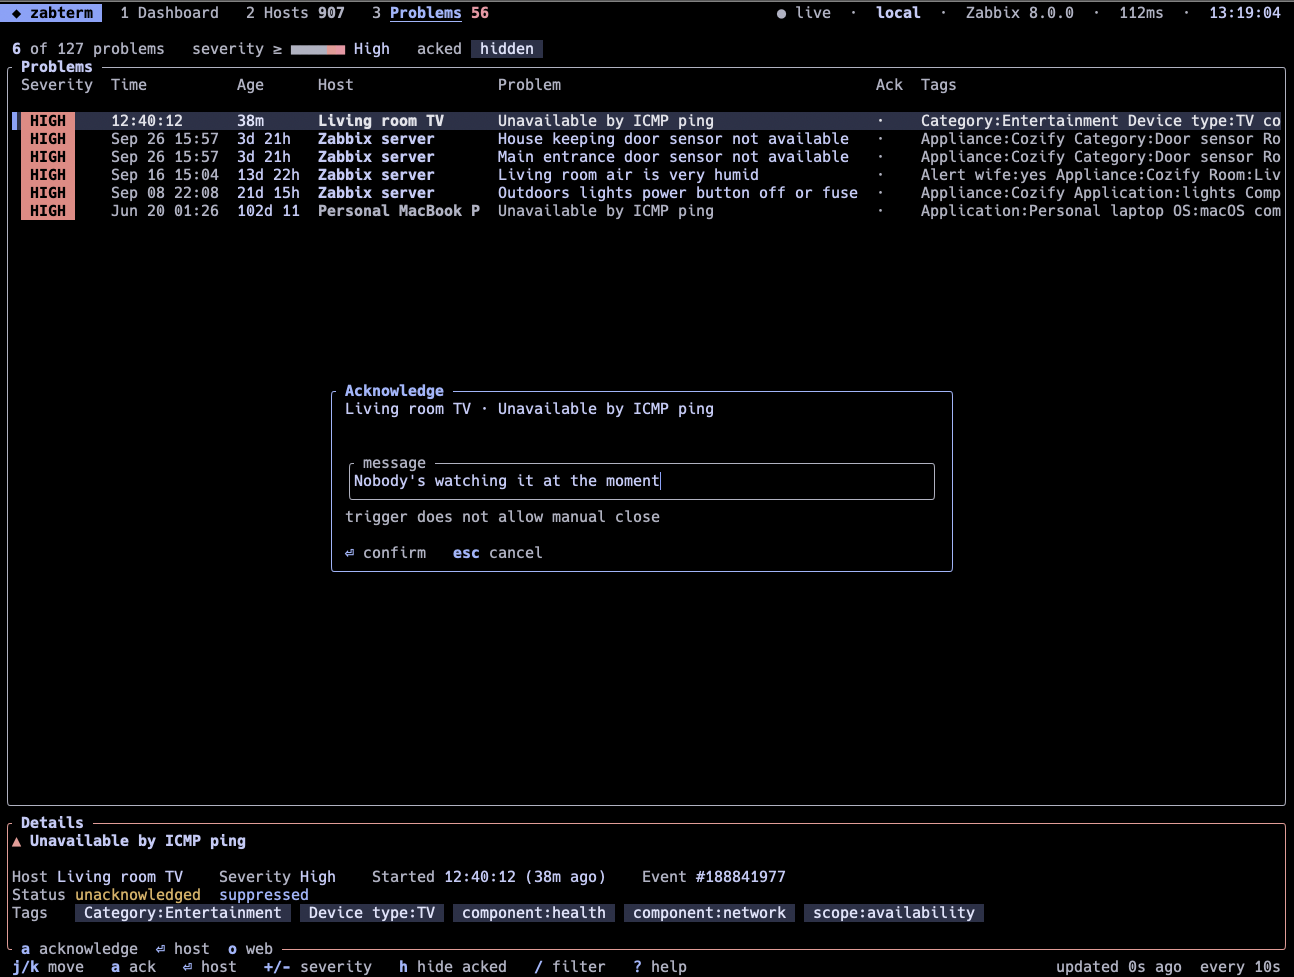
This was just a quick tip about Zabterm – there's more than this to it, feel free to explore. And by the way, if your Zabbix instance is large, it is possible that the current version of Zabterm does not work for you. I already submitted a patch which at least made it load for me for my work Zabbix, but I'm sure that the Zabterm author can fix it better than Claude's quick fix it made for me.
