Can you verify if your iPhone battery drains faster during summer compared to other seasons with Zabbix? Of course you can!
I have always felt that during summer my phone battery drains faster than during the darker seasons. This would only be logical, as during summer the phone display must be brighter than during the darker seasons. Additionally, during summer we also tend to be more outdoors, so instead of home Wi-Fi the phone is using mobile data. On the other hand, during winter time if you are outdoors, the cold weather might affect battery life as well.
But how severe is the drainage difference? Let's check it out!


What does this prove?
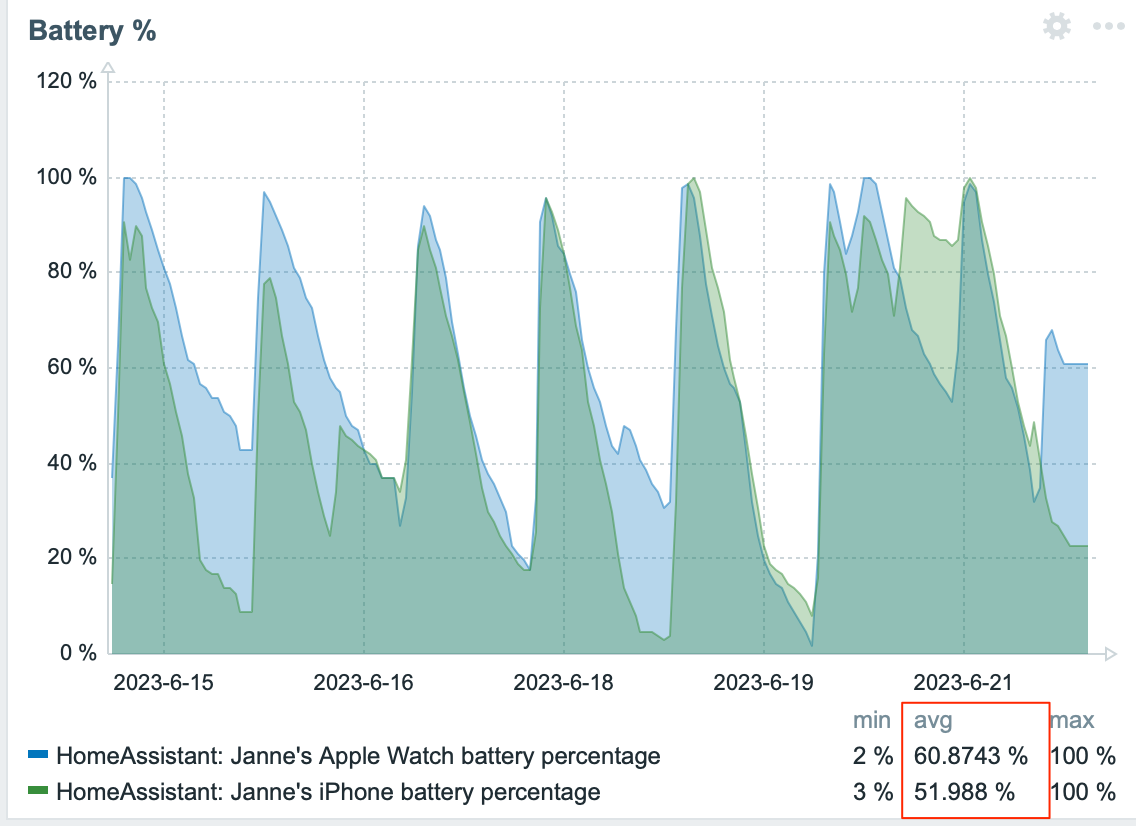
Well, necessarily not much as this is not very scientific method. However, my day-to-day phone usage does not vary much -- if anything, during March/April the drainage should have been worse, as I have a tendency to participate one daily afternoon meeting from outdoors; I'll stroll around with our baby and get some fresh air whilst being online in the meeting. Now in June I've been enjoyng my summer holiday. But clearly something is going on as the average percentage difference is such high. For my Apple Watch, the difference is there but not that significant.
Why am I not comparing the data with the iPhone activity? Heh -- to prove my point with my earlier "Things that WILL go wrong when monitoring IoT devices" post; something has happened as my Home Assistant won't provide that information anymore. The same happened with connection type data. I'll have to take a look at that some day, but lately I've been busy as a bee with 1) summer holiday and 2) preparing material for Zabbix Summit 2023.
Real world applications for this kind of cherry-picking
Even though this post is very thin in its contents, I'm posting this as a hint for you how you can utilise Zabbix in more serious monitoring targets in this way. Need to compare UPS battery depletion rate? Disk space usage rate? CPU usage? Concurrent connections? Whatever the data, many times it's useful to stop for a moment and compare how things were (some time units) ago.
Yes, you can simply pick a longer time period in Zabbix time picker and see the data for one year or whatever, and most of the time it will show you a change in pattern, but if the changes are more subtle or the graph is very busy, sometimes zooming in to shorter time periods in history will show you something that you might otherwise miss.
For example, if I expand the time range for the battery usage, not only you'll notice that the Home Assistant iCloud ride has been a bumpy one, but also the details do get lost when the time range is longer.

More ways to compare historical data
I didn't build any new graphs or dashboards for this quick experiment, I merely used the time picker. In case one would need to have comparison data available any time, using time shift and additional data sets would help you out. And, like many of us do, one way to dive deeper into data collected by Zabbix would be to analyse it in Grafana, but that's a story for another day.
I have been working at Forcepoint since 2014 and I'm happy that my work won't drain my personal battery.
