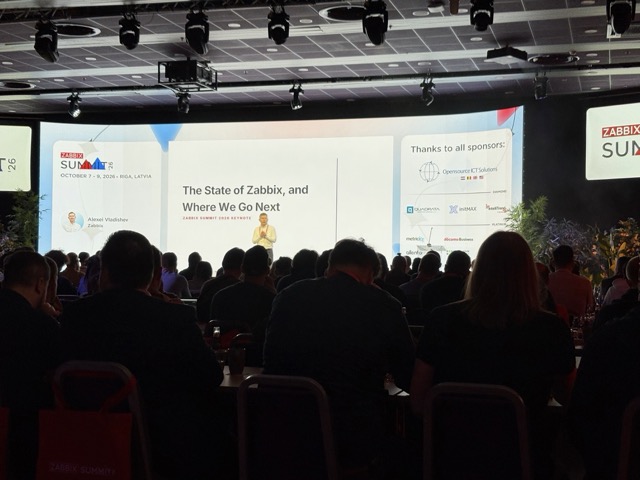
Zabbix Summit 2026 is over — huge thanks to whole Zabbix team and all my regular summit friends. Once again it was a blast! This was my seventh summit, out of which fifth year as a speaker. I'll blog about my talk later, but here's now something else.
Tracing Zabbix Summit Keynote
A day before leaving towards Zabbix Summit I got an idea. Zabbix 8.0 got proper APM, so why not try to ‘trace’ Alexei's keynote and while doing so, see what happens if Zabbix encounters a trace that lasts for about 40 minutes.
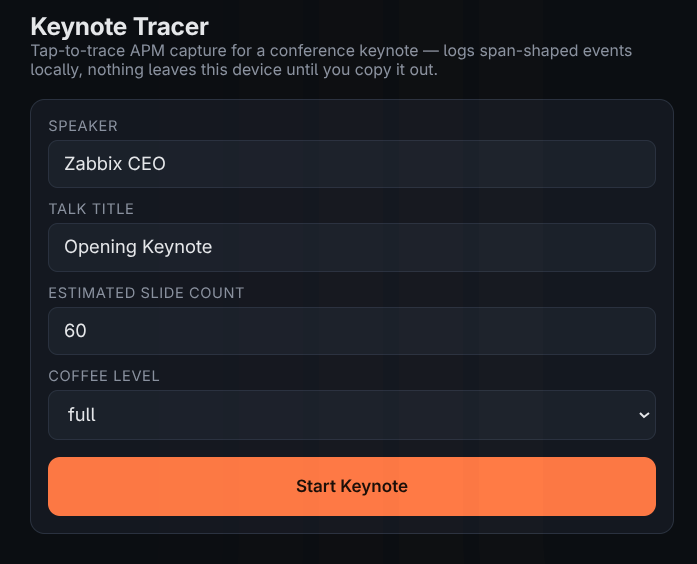
Claude quickly spun up a local webpage for me. Yes, this is very lacking, but as this is not a serious thing at all, this was enough. Idea is that whenever something happens on stage – topic moves to next section, audience laughs, Alexei loses pointer – I click on relevant button and the timestamp for that will be recorded. In the end the results will be then saved to suitable format so it can be sent to Zabbix for tracing.
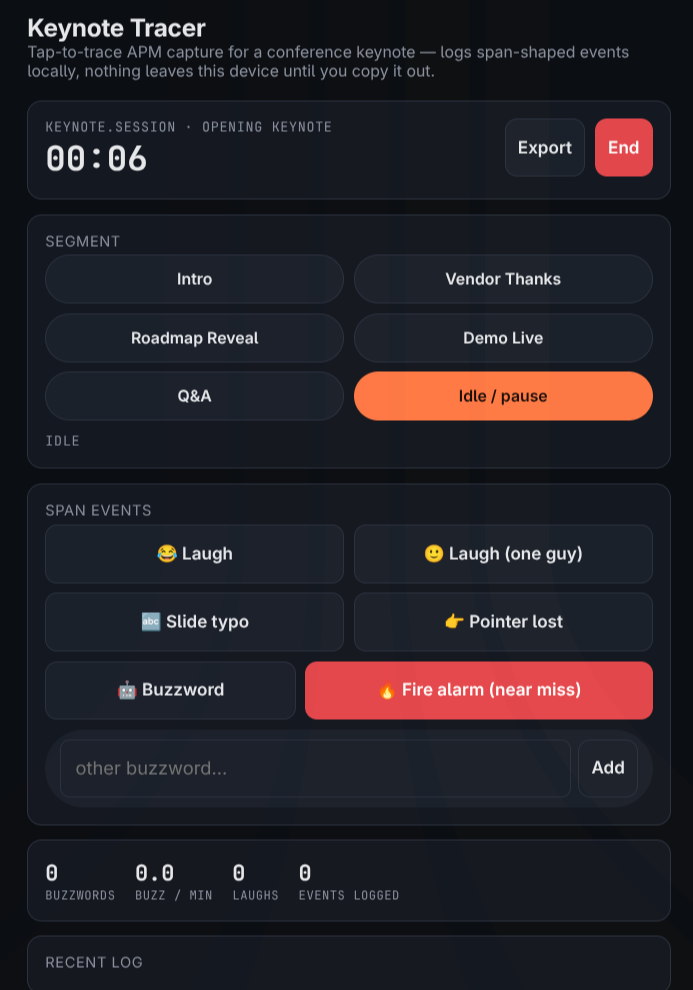
While still at home, my early tests looked promising. I got events happening on timeline, for example.
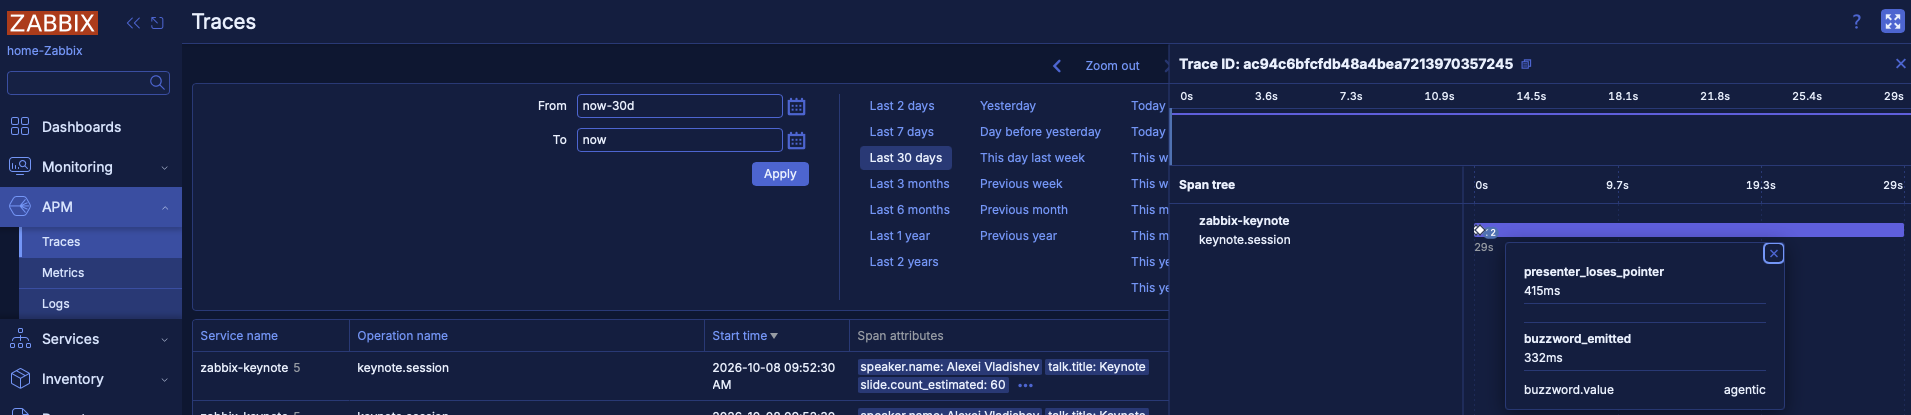
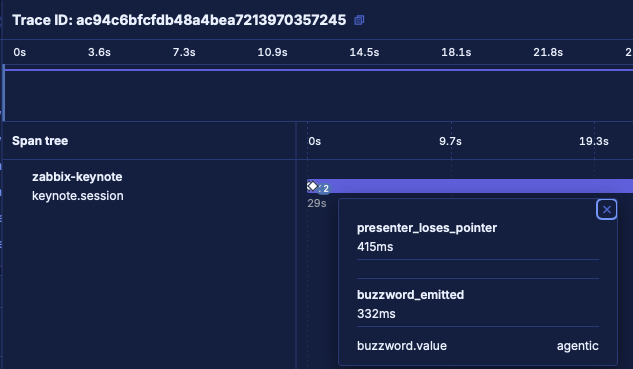
But see what happens with the “production” version that's 38 minutes long.
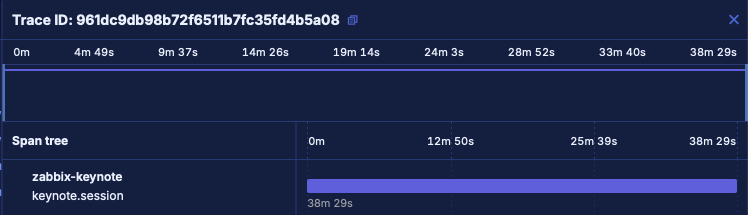
There's nothing. I've tried to click around and figure what's going on, but truly the UI is not showing anything. The raw JSON file contains the events I did click during the talk, and my Clickhouse has those too. Zabbix APM code or UX visual issue with overly long traces? I'll poke some more and if I find out this is an actual bug and not just me being new with all this Zabbix APM stuff, I'll then file a Zabbix bug report. Oh well, it was a good try!
Tip: Add gradients and other CSS effects to Zabbix
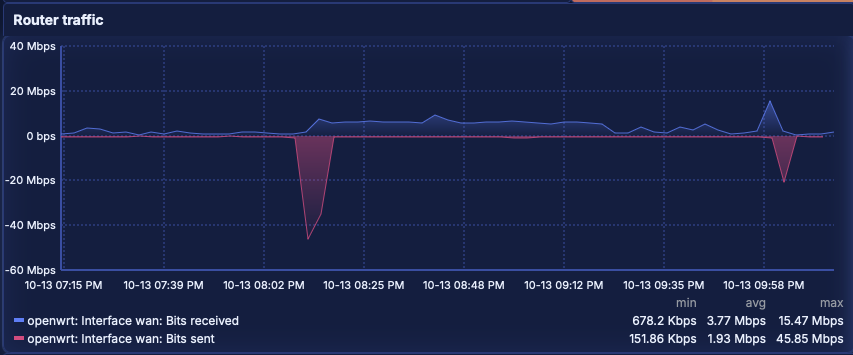
Also right before the summit I learned that it is actually possible to add all kinds of visual effects to Zabbix without a need to touch Zabbix codebase manually or even without any additional browser add-ons. Here's gradients on graphs and faint glow around widget corners.
How?
Through nginx substitution filter module. The idea is that nginx injects additional content to page mid-flight. As I don't totally do not want to break YOUR nginx just because you cannot live without trying this out, I'm not providing you any “Here's a ready config file for you” guide, but rather do it like this. Config snippets and code are courtesy of Opencode Big Pickle prompting:
Add new location blocks for additional CSS
Zabbix "glow" skin + visual extras.
# Both assets live in /etc/nginx, deliberately outside the Zabbix
# docroot, so a Zabbix upgrade cannot overwrite them.
# Bump ?v= below whenever either file changes.
location = /zabbix-glow.css {
    alias /etc/nginx/zabbix-glow.css;
    default_type text/css;
    add_header Cache-Control "public, max-age=600";
}

location = /zabbix-grad.js {
    alias /etc/nginx/zabbix-grad.js;
    default_type application/javascript;
    add_header Cache-Control "public, max-age=600";
}
Add inside location ~ [^/]\.php(/|$) {
	# Rewrite only the HTML emitted by PHP. sub_filter_types text/html
        # means chart*.php (SVG/PNG), the JSON-RPC API and the CSS/JS assets
    	# served from location / all pass through byte-for-byte untouched.
    	sub_filter_types text/html;
    	sub_filter_once on;
    	sub_filter "</head>" "<link rel=\"stylesheet\" type=\"text/css\" href=\"zabbix-glow.css?v=2\"><script defer src=\"zabbix-grad.js?v=2\"></script></head>";
zabbix-glow.css
/*
Zabbix "glow" skin
Injected into every Zabbix page by nginx sub_filter. Config: /etc/nginx/sites-available/zabbix (location ~ .php$) Edit THIS file only to tweak the look -- no nginx reload needed, just hard-refresh in the browser. The ?v= in the injected is what defeats the browser cache; bump it when changing this file. Scoped to the dark themes via html[theme=...] so anyone on a light theme sees no change at all. Companion script: /etc/nginx/zabbix-grad.js (gradients + gauge zone). It publishes --zbx-glow-color onto each gauge; the rules below read it. */ /* ================================================================== TIME-SERIES / GRAPH WIDGET BOXES The graph widgets (graph, svggraph) render server-side SVG, so the plot itself is styleable -- see the problem-band and hintbox rules further down. This block only dresses the widget container. ================================================================== */ html[theme="dark-blue-theme"] .dashboard-widget-graph, html[theme="dark-blue-theme"] .dashboard-widget-svggraph, html[theme="dark-blue-theme"] .dashboard-widget-itemhistory, html[theme="dark-blue-theme"] .dashboard-widget-scatterplot, html[theme="dark-blue-theme"] .dashboard-widget-item { border-radius: 8px; box-shadow: 0 0 0 1px rgba(61, 152, 255, 0.22), 0 0 18px rgba(61, 152, 255, 0.26), inset 0 0 28px rgba(0, 58, 122, 0.40); } /* Softer, dimmer glow on the plain dark theme. */ html[theme="dark-theme"] .dashboard-widget-graph, html[theme="dark-theme"] .dashboard-widget-svggraph, html[theme="dark-theme"] .dashboard-widget-itemhistory { border-radius: 8px; box-shadow: 0 0 0 1px rgba(255, 255, 255, 0.10), 0 0 16px rgba(0, 0, 0, 0.55); } /* ================================================================== 1b. GAUGE -- threshold-aware glow zabbix-grad.js reads which threshold band the value currently sits in (using the widget's own threshold colours) and publishes it as --zbx-glow-color on the gauge root. Default is the neutral blue, so a gauge with no thresholds still looks right before JS runs. ================================================================== */ html[theme="dark-blue-theme"] .svg-gauge { --zbx-glow-color: #3d98ff; } html[theme="dark-blue-theme"] .svg-gauge-value-arc-sector { filter: drop-shadow(0 0 4px var(--zbx-glow-color, #3d98ff)); } html[theme="dark-blue-theme"] .svg-gauge-needle { filter: drop-shadow(0 0 3px var(--zbx-glow-color, #3d98ff)); } html[theme="dark-blue-theme"] .svg-gauge-value { filter: drop-shadow(0 0 5px var(--zbx-glow-color, #3d98ff)); } /* Whole-gauge halo, drawn around the widget rather than the geometry. */ html[theme="dark-blue-theme"] .dashboard-widget-gauge { filter: drop-shadow(0 0 12px color-mix(in srgb, var(--zbx-glow-color, #3d98ff) 45%, transparent)); } /* ================================================================== 1c. PIE CHART -- also SVG, so the arcs glow directly. ================================================================== */ html[theme="dark-blue-theme"] .svg-pie-chart-arc { filter: drop-shadow(0 0 4px rgba(61, 152, 255, 0.45)); } /* ================================================================== 3. PROBLEM SEVERITY TINTING CSeverityHelper::getStyle() puts one of these classes on the problem cell, and they are also used on severity badges throughout the UI. Zabbix only sets a flat background from them; this adds the outer glow so severity reads pre-attentively. Escalates as severity rises. Info / not-classified are deliberately left alone -- they are not problems worth shouting about. ================================================================== */ html[theme="dark-blue-theme"] .warning-bg { box-shadow: 0 0 0 1px rgba(255, 200, 89, 0.35), 0 0 10px rgba(255, 200, 89, 0.25); } html[theme="dark-blue-theme"] .average-bg { box-shadow: 0 0 0 1px rgba(255, 160, 89, 0.45), 0 0 12px rgba(255, 160, 89, 0.32); } html[theme="dark-blue-theme"] .high-bg { box-shadow: 0 0 0 1px rgba(233, 118, 89, 0.55), 0 0 14px rgba(233, 118, 89, 0.40); } html[theme="dark-blue-theme"] .disaster-bg { box-shadow: 0 0 0 1px rgba(228, 89, 89, 0.70), 0 0 18px rgba(228, 89, 89, 0.55); } /* ================================================================== 4. GRAPH PROBLEM BANDS CSvgGraphProblems draws each problem period aswith fill #AA4455 at opacity 0.1 -- nearly invisible on a dark background, which defeats the point of drawing it. Lift it and give the base handle a matching edge so "was there an incident here" is answerable at a glance. ================================================================== */ html[theme="dark-blue-theme"] .svg-graph-problem-box { opacity: 0.24 !important; } html[theme="dark-blue-theme"] .svg-graph-problem-handle { filter: drop-shadow(0 0 4px rgba(233, 118, 89, 0.75)); } html[theme="dark-blue-theme"] .svg-graph-problems line { stroke-opacity: 0.55; } /* ================================================================== 5. SERVER-UNREACHABLE BANNER servercheck.js only toggles this element in/out of view (it writes inline display:flex / none itself, so display is deliberately left alone here -- overriding it would just fight the script). It only reveals the element when the check fails, so whenever this is on screen the server really is down. ================================================================== */ html[theme="dark-blue-theme"] .msg-global-footer { min-height: 44px; padding: 10px 16px; margin: 0; font-weight: 700; letter-spacing: 0.02em; text-align: center; color: #1a0000; background: #e45959; border: 0; box-shadow: 0 0 24px rgba(228, 89, 89, 0.65); animation: zbx-banner-pulse 1.6s ease-in-out infinite; } @keyframes zbx-banner-pulse { 0%, 100% { box-shadow: 0 0 18px rgba(228, 89, 89, 0.50); } 50% { box-shadow: 0 0 34px rgba(228, 89, 89, 0.90); } } /* ================================================================== 6. SPARKLINES .svg-sparkline-area is an SVGwhose fill/fill-opacity come from inline attributes (set by component.z-sparkline.js), so this is a container-level glow only; zabbix-grad.js turns the flat fill into a vertical gradient the same way it does for graph areas. ================================================================== */ html[theme="dark-blue-theme"] .svg-sparkline { --zbx-glow-color: #3d98ff; } html[theme="dark-blue-theme"] .svg-sparkline-area { filter: drop-shadow(0 0 3px color-mix(in srgb, var(--zbx-glow-color, #3d98ff) 55%, transparent)); } /* ================================================================== 7. GRAPH HINTBOX / CROSSHAIR The hover readout and helper line. Pure presentation: lift it off the plot, sharpen the metric colour chips, make it readable against a busy graph background. ================================================================== */ html[theme="dark-blue-theme"] .svg-graph-hintbox { background: rgba(0, 24, 51, 0.94); border: 1px solid rgba(61, 152, 255, 0.45); border-radius: 5px; box-shadow: 0 6px 22px rgba(0, 0, 0, 0.55), 0 0 12px rgba(61, 152, 255, 0.25); padding: 5px 8px; } html[theme="dark-blue-theme"] .svg-graph-hintbox-item-color, html[theme="dark-blue-theme"] .svg-graph-hintbox-trigger-color { box-shadow: 0 0 0 1px rgba(255, 255, 255, 0.45); } /* Helper line: lift it clear of the data. */ html[theme="dark-blue-theme"] .svg-graph-line-auxiliary { stroke-opacity: 0.9; } /* ================================================================== OPTIONAL: gentle breathing pulse on graph widgets. Disabled by default -- it draws the eye, which can be annoying on a wall-mounted NOC display. Uncomment to enable. ================================================================== / / @keyframes zbx-glow-pulse { 0%, 100% { box-shadow: 0 0 0 1px rgba(61,152,255,0.22), 0 0 14px rgba(61,152,255,0.22), inset 0 0 24px rgba(0,58,122,0.40); } 50% { box-shadow: 0 0 0 1px rgba(61,152,255,0.40), 0 0 26px rgba(61,152,255,0.45), inset 0 0 34px rgba(0,58,122,0.55); } } html[theme="dark-blue-theme"] .dashboard-widget-graph { animation: zbx-glow-pulse 6s ease-in-out infinite; } */ /* ================================================================== Respect users who ask for less motion. ================================================================== */ @media (prefers-reduced-motion: reduce) { html[theme="dark-blue-theme"] * { animation: none !important; transition: none !important; } }⏎
zabbix-grad.js
/* Zabbix skin script: gradients + threshold-aware gauge glow Injected alongside /etc/nginx/zabbix-glow.css by nginx sub_filter. Zabbix has NO gradient support of its own -- its "Fill" option is a flat fill-opacity, and there is noanywhere in the Zabbix source. The graph widgets render server-side SVG and the sparklines are d3-built SVG, so their area paths are real DOM nodes we can restyle:(graph, svggraph) (tophosts / item cards) CSS alone cannot do this, because fill:url(#id) requires aelement to exist inside that particular cannot create elements, so we build the defs here instead. The second job is the gauge: it reads which of the widget's own threshold bands the current value sits in and republishes that band's colour as --zbx-glow-color, so the glow turns amber/red as the reading approaches a limit instead of staying blue. */ (function () { if (window.__zbxGraphGradients) { return; } window.__zbxGraphGradients = true; var SVG_NS = 'http://www.w3.org/2000/svg'; var PREFIX = 'zbx-grad-'; /* ------------------------------------------------------------------ Shared helpers ------------------------------------------------------------------ */ // "rgb(61, 152, 255)" or "#3d98ff" -> [61, 152, 255] function toRgb(color) { var hex = /^#([0-9a-f]{3}|[0-9a-f]{6})$/i.exec(String(color).trim()); if (hex) { var h = hex[1]; if (h.length === 3) { h = h[0] + h[0] + h[1] + h[1] + h[2] + h[2]; } return [parseInt(h.slice(0, 2), 16), parseInt(h.slice(2, 4), 16), parseInt(h.slice(4, 6), 16)]; } var parts = String(color).match(/[\d.]+/g); return parts && parts.length >= 3 ? parts.slice(0, 3).map(Number) : [61, 152, 255]; } function makeGradient(defs, id, rgb, topOpacity, bottomOpacity) { var gradient = document.createElementNS(SVG_NS, 'linearGradient'); gradient.setAttribute('id', id); // Vertical fade: strongest at the top, gone at the axis. gradient.setAttribute('x1', '0'); gradient.setAttribute('y1', '0'); gradient.setAttribute('x2', '0'); gradient.setAttribute('y2', '1'); var top = document.createElementNS(SVG_NS, 'stop'); top.setAttribute('offset', '0'); top.setAttribute('stop-color', 'rgb(' + rgb.join(',') + ')'); top.setAttribute('stop-opacity', String(topOpacity)); var bottom = document.createElementNS(SVG_NS, 'stop'); bottom.setAttribute('offset', '1'); bottom.setAttribute('stop-color', 'rgb(' + rgb.join(',') + ')'); bottom.setAttribute('stop-opacity', String(bottomOpacity)); gradient.appendChild(top); gradient.appendChild(bottom); defs.appendChild(gradient); return gradient; } function ensureDefs(svg) { var defs = svg.querySelector(':scope > defs'); if (!defs) { defs = document.createElementNS(SVG_NS, 'defs'); // Must be the first child so the ids resolve in this <svg>. svg.insertBefore(defs, svg.firstChild); } return defs; } /* ------------------------------------------------------------------ Area gradients (graph + sparkline) ------------------------------------------------------------------ */ /** @param {Element} svg the @param {string} sel selector for the area paths @param {number} topOp stop-opacity at the top of the plot */ function gradientise(svg, sel, topOp) { var areas = svg.querySelectorAll(sel); if (!areas.length) { return; } var defs = ensureDefs(svg); Array.prototype.forEach.call(areas, function (area, i) { var id = PREFIX + i; if (!svg.querySelector('#' + id)) { // The metric colour lives in an inline <style> block (graph) or // in a fill attribute (sparkline); getComputedStyle resolves both. // Read it per area -- each dataset has its own colour. makeGradient(defs, id, toRgb(getComputedStyle(area).fill), topOp, 0.02); } area.style.fill = 'url(#' + id + ')'; // The gradient carries its own alpha, so the flat fill-opacity Zabbix // wrote inline has to go -- otherwise it multiplies down to invisible. area.style.fillOpacity = '1'; }); } /* ------------------------------------------------------------------ 1b. Threshold-aware gauge glow Geometry note: both the value arc and every threshold sector are built by the widget's #defineArc()/#polarToCartesian(), which is x = rcos(a), y = 1 + rsin(a). So the first coordinate pair of each path maps back to an angle by atan2(y - 1, x). Because we only ever compare two angles produced by that same function, no correction for the widget's own rotation is needed -- and we never depend on the needle, whose transform origin makes the frame ambiguous. ------------------------------------------------------------------ */ function pathAngles(d) { if (!d) { return null; } // "M x1 y1 A r r 0 large sweep x2 y2 L ..." var m = /^\s*M\s+(-?[\d.eE+]+)\s+(-?[\d.eE+]+)\s+A\s+(-?[\d.eE+]+)\s+(-?[\d.eE+]+)\s+(-?[\d.eE+]+)\s+(\d)\s+([01])\s+(-?[\d.eE+]+)\s+(-?[\d.eE+]+)/.exec(d); if (!m) { return null; } return [ Math.atan2(parseFloat(m[2]) - 1, parseFloat(m[1])) * 180 / Math.PI, Math.atan2(parseFloat(m[9]) - 1, parseFloat(m[8])) * 180 / Math.PI ]; } function gaugeZoneColour(gauge) { var valueArc = gauge.querySelector('.svg-gauge-value-arc-sector'); if (!valueArc) { return null; } var valueAngles = pathAngles(valueArc.getAttribute('d')); if (!valueAngles) { return null; } // For the value arc, defineArc(-angle/2, value_angle) means the M // point sits at the value angle and the arc endpoint at the sweep // start -- so only the first angle is the reading itself. var valueAngle = valueAngles[0]; var sectors = gauge.querySelectorAll('.svg-gauge-thresholds-arc-sector'); if (!sectors.length) { return null; } var fallback = null; for (var i = 0; i < sectors.length; i++) { var range = pathAngles(sectors[i].getAttribute('d')); if (!range) { continue; } var lo = Math.min(range[0], range[1]); var hi = Math.max(range[0], range[1]); var fill = sectors[i].style && sectors[i].style.fill ? sectors[i].style.fill : null; // Sectors tile the whole sweep; a band with no colour set means // "below the first threshold", so remember the last coloured one. if (fill) { fallback = fill; } if (valueAngle >= lo && valueAngle <= hi) { return fill || fallback; } } return null; } function updateGauge(gauge) { var colour = gaugeZoneColour(gauge); if (colour) { gauge.style.setProperty('--zbx-glow-color', colour); } else { // No thresholds (or no value arc): fall back to the CSS default. gauge.style.removeProperty('--zbx-glow-color'); } } /* ------------------------------------------------------------------ Scanning ------------------------------------------------------------------ */ function scan() { Array.prototype.forEach.call(document.querySelectorAll('svg'), function (svg) { if (svg.querySelector('.svg-graph-area')) { gradientise(svg, '.svg-graph-area', 0.45); } if (svg.querySelector('.svg-sparkline-area')) { gradientise(svg, '.svg-sparkline-area', 0.55); } if (svg.querySelector('.svg-gauge-value-arc-sector')) { updateGauge(svg); } }); // Gauges/sparklines sometimes sit in a <div> wrapper rather than a // <svg> root, so also catch any gauge root not visited above. Array.prototype.forEach.call(document.querySelectorAll('.svg-gauge, .svg-sparkline'), function (root) { var svg = root.tagName.toLowerCase() === 'svg' ? root : root.querySelector('svg'); if (svg) { if (root.classList.contains('svg-gauge')) { updateGauge(svg); } if (root.classList.contains('svg-sparkline') && svg.querySelector('.svg-sparkline-area')) { gradientise(svg, '.svg-sparkline-area', 0.55); } } }); } var pending = null; function schedule() { if (pending) { return; } // Zabbix redraws on every data refresh and gauges animate their arc; // coalesce those bursts rather than re-scanning per mutation. pending = setTimeout(function () { pending = null; scan(); }, 250); } if (document.readyState === 'loading') { document.addEventListener('DOMContentLoaded', schedule); } else { schedule(); } // Re-apply when a chart is redrawn (childList) or when an arc animates // (the gauge rewrites 'd' each frame). new MutationObserver(schedule).observe(document.documentElement, { childList: true, subtree: true, attributes: true, attributeFilter: ['d'] }); })();⏎
