
Can you monitor your website visitor rate with Zabbix? Of course you can! By day, I am a lead site reliability engineer in a global cyber security company. By night, I monitor my home with Zabbix & Grafana and do some weird experiments with them.
I have this website hosted in a domain hotel, and among other features the admin panel has some standard website access log analysers (such as awstats) available for me to see activity of this site. That's cool, but also boringly easy, and requires me to login to that admin panel instead of me using my trusted single pane of glass that is Zabbix.
Let's connect to site logs
If I login to my site over ssh/sftp, my home directory has a preconfigured access_logs directory. Like the name says, it contains the website access logs in the usual format you would expect it to be:
35.166.xxx.xxx - - [26/Jan/2023:04:24:37 +0200] "GET / HTTP/1.1" 200 10055 "http://whatsuphome.fi" "Mozilla/5.0 (X11; Linux x86_64) AppleWebKit/537.36 (KHTML, like Gecko) Chrome/83.0.4103.97 Safari/537.36"
That's great, but how to monitor that in real-time with Zabbix? Let's use sshfs -- it's like NFS or CIFS, but allows you to mount stuff over ssh. On my dear Raspberry Pi 4 which runs my Zabbix, running
sudo mkdir /var/log/whatsuphome && sudo chown zabbix /var/log/whatsuphome
sudo sshfs -o allow_other mywhatsuphomeaccount@myhotelname:access_logs /var/log/whatsuphome
did mount my remote server access_logs directory perfectly fine.
Time for monitoring
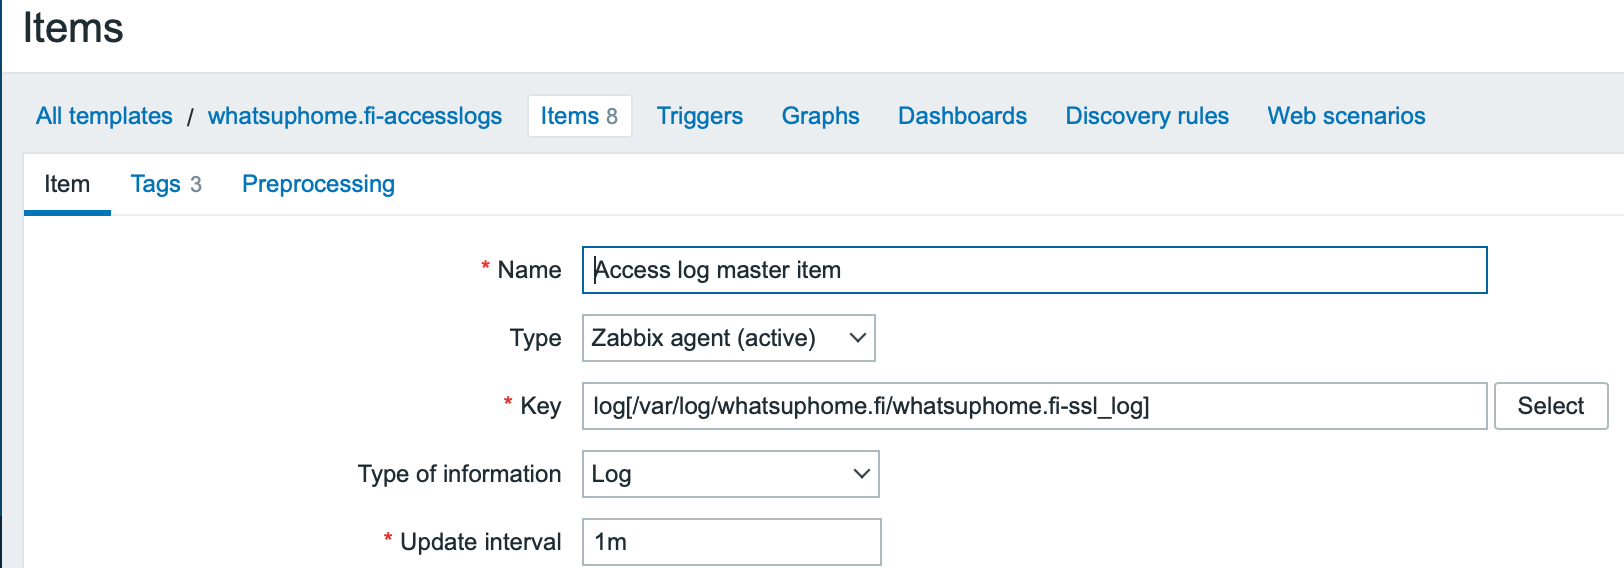
Now that we have our log file, the rest is very straightforward and standard log file monitoring. First, let's add a master item that reads the log.
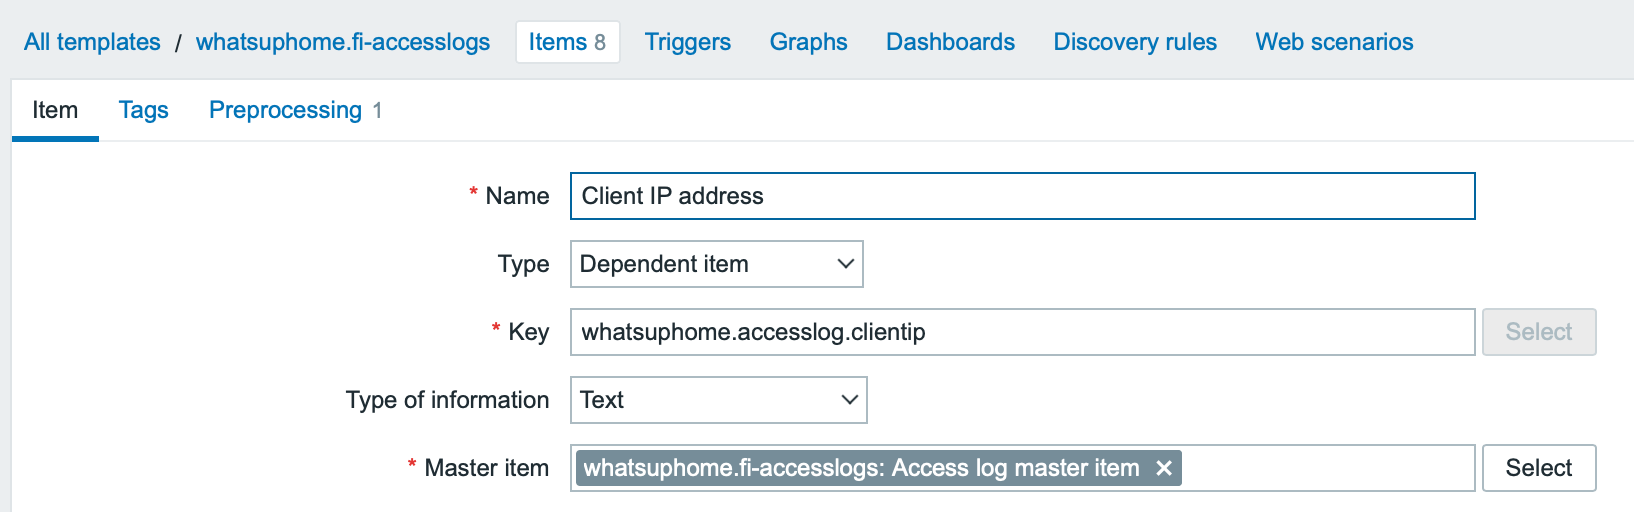
Next, let's add a dependent item that grabs the visitor IP address part from a log line.
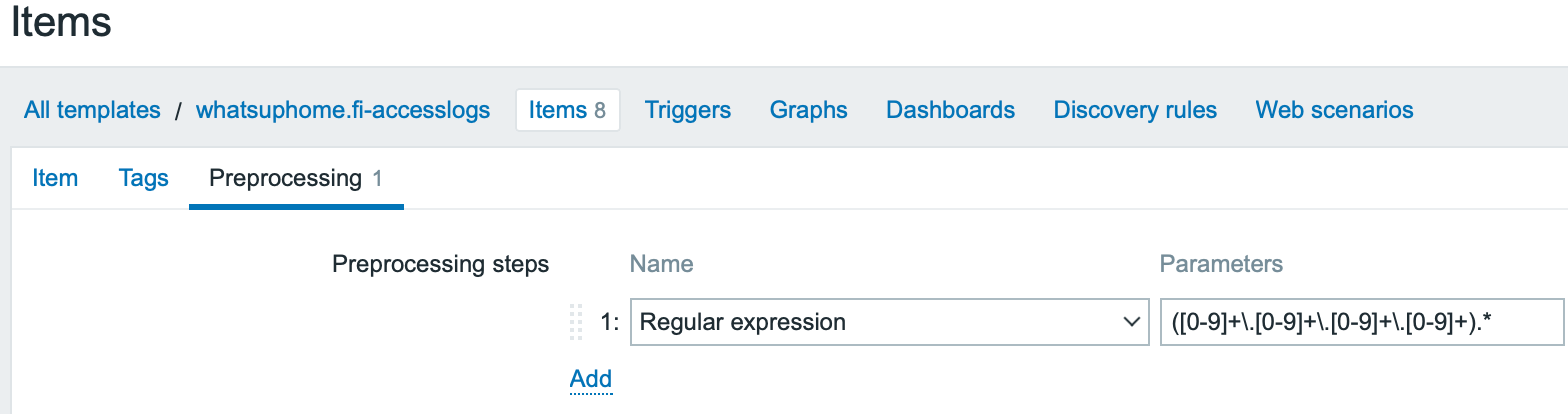
... and some item pre-processing to grab only the IP
... after adding a few more items, here's my template.

I'm currently not parsing the referrer, exact URL or user-agent values, as for the most part those would just add unnecessary noise and load for my poor little home Zabbix.
Dashboard time!
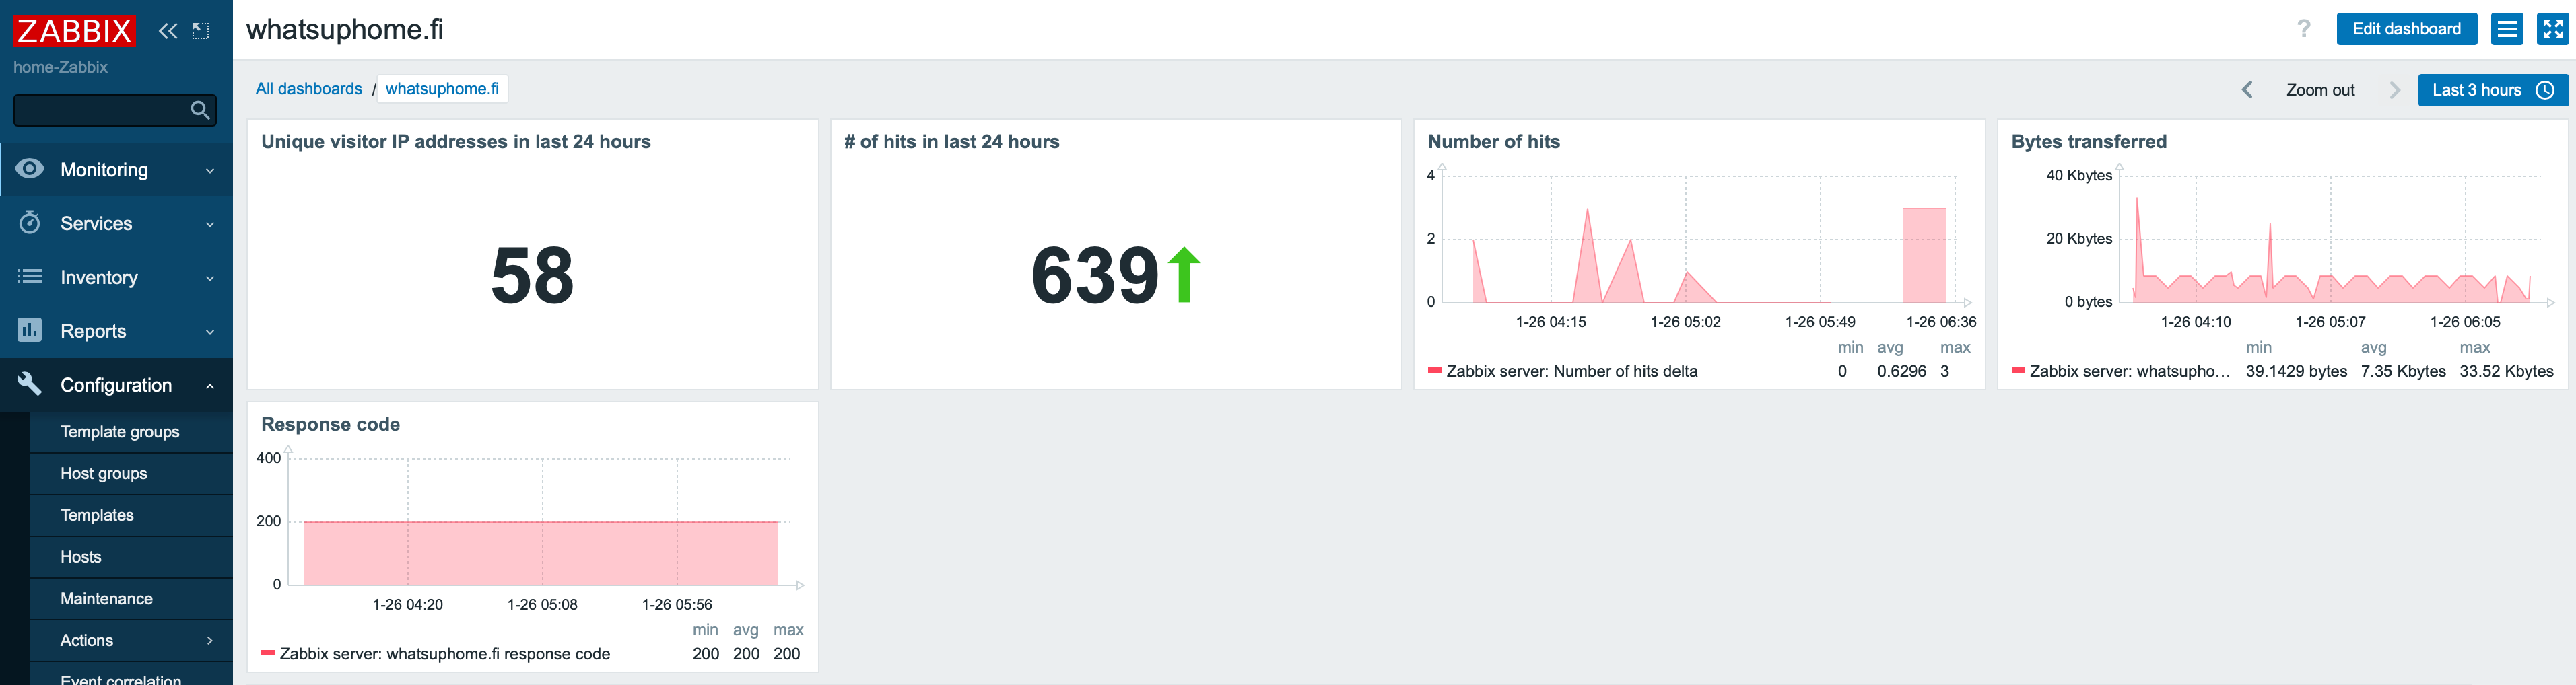
So, finally I created a dashboard showing the number of unique IP addresses & hits during the past 24 hours and some graphs. Now that I've not posted any posts in a while, welcome to Tumbleweedville!
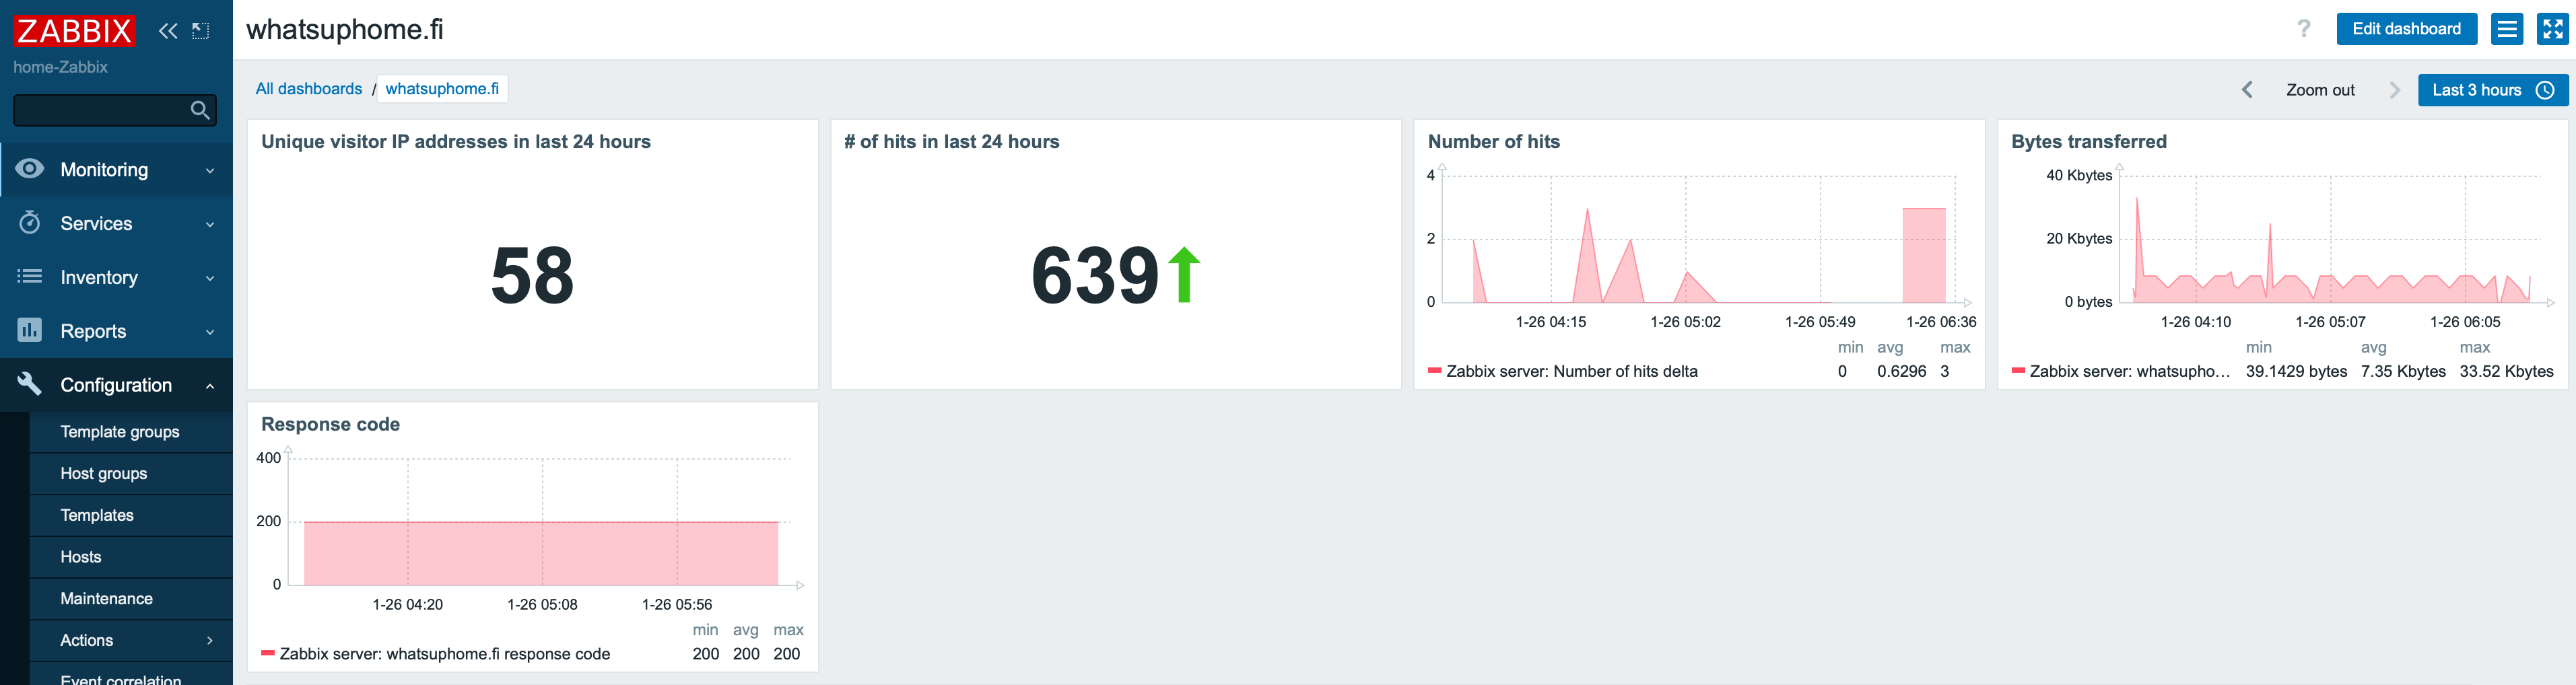
After publishing this post, I'll wait for a while and then update the post with a new screenshot, so we'll get to see the incredible visitor surge that will be counted in at least tens of new IP addresses.
Update #1 about 15 minutes after publishing the post

Update #2 one hour after publishing the post

Update #3 one day after publishing the post


Comments (2)
Nginx Acces logs template
Dan (not verified)
Hi, awesome stuff can you also export the template and maybe upload is somewhere?
Cheers
Zabbix
Gregoriy (not verified)
Interesting