

Can you integrate a CO2 meter which really wouldn't want you to integrate it with Zabbix, with Zabbix? Of course you can! By day, I'm a Lead Site Reliability Engineer in a global cyber security company. By night, I monitor my home with Zabbix & Grafana and do some weird experiments with them.
I have an el cheapo environmental monitor by Netatmo, showing the temperature, humidity, CO2 level and noise level.
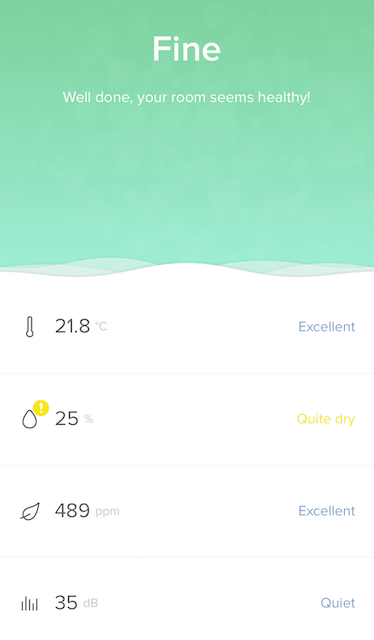
This device is an IoT monitor with a phone app, but even though Netatmo has a nice developer API for its products, this particular model does not support that functionality. Also, my dear Cozify does not support the device. So, is my all hope lost for getting the data to Zabbix? Of course not!
Yes, it's Siri, once again
As the device is HomeKit compatible, I was able to utilise iOS Shortcuts for this magic to happen. Even though I do not have AppleTV or HomePod to make the home automations to work through HomeKit, my iPhone can query the values from the Netatmo device just fine.
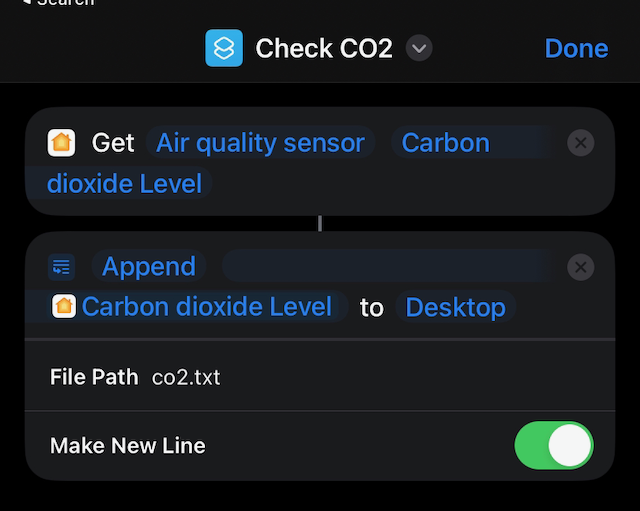
First I created a shortcut called Check CO2.
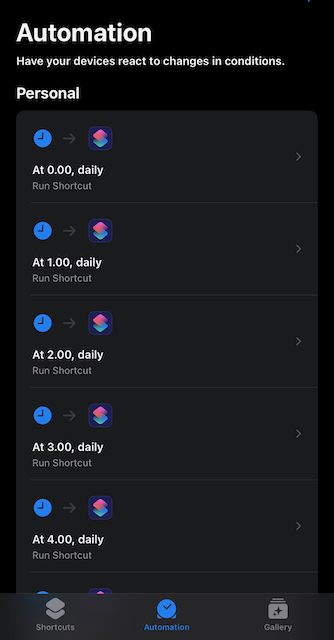
... and then I had the most awful time when I had to manually add all these entries to be run exactly on the hour to Shortcuts Automations. Dear Apple, I want a cronjob compatible option for defining these, so I could have just done 0 * * * * Check_CO2 or so.
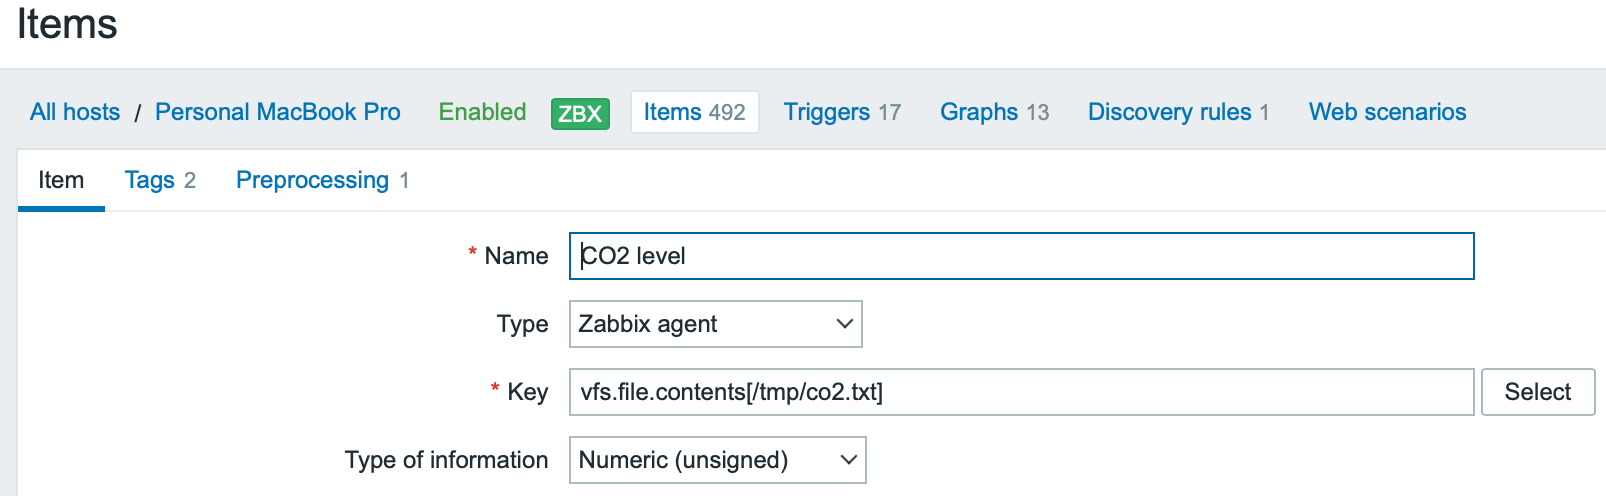
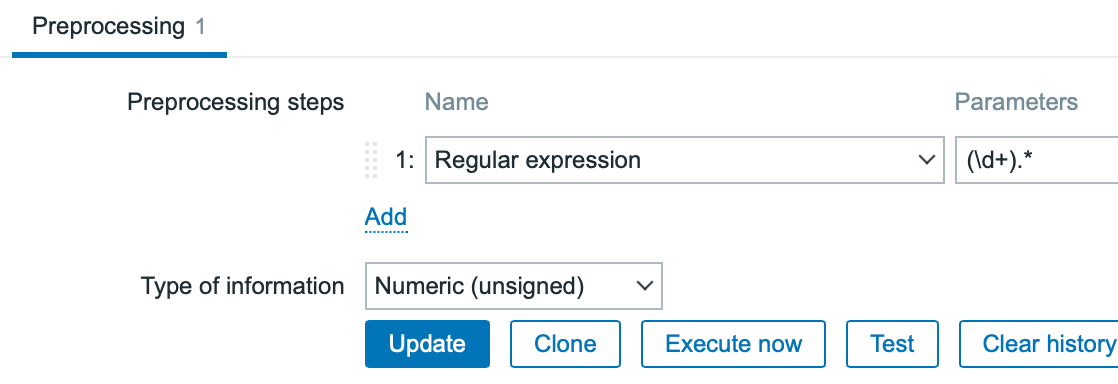
Let's go to Zabbix
By now this probably starts to get boring to you, my readers, as I seem to utilise this same Siri & text file methodology too often. But hey, this works! My MacBook reads the text file, parses the numeric value from there and I have my data.

Adding dashboards
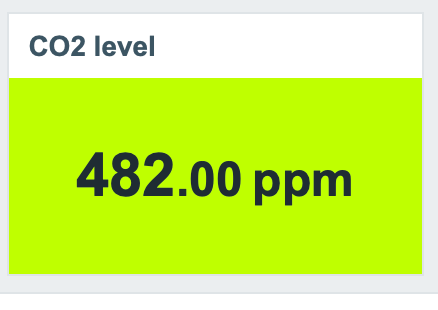
I added the value to be part of the quick glance overview dashboard of mine, of course with the dynamic background widget color.
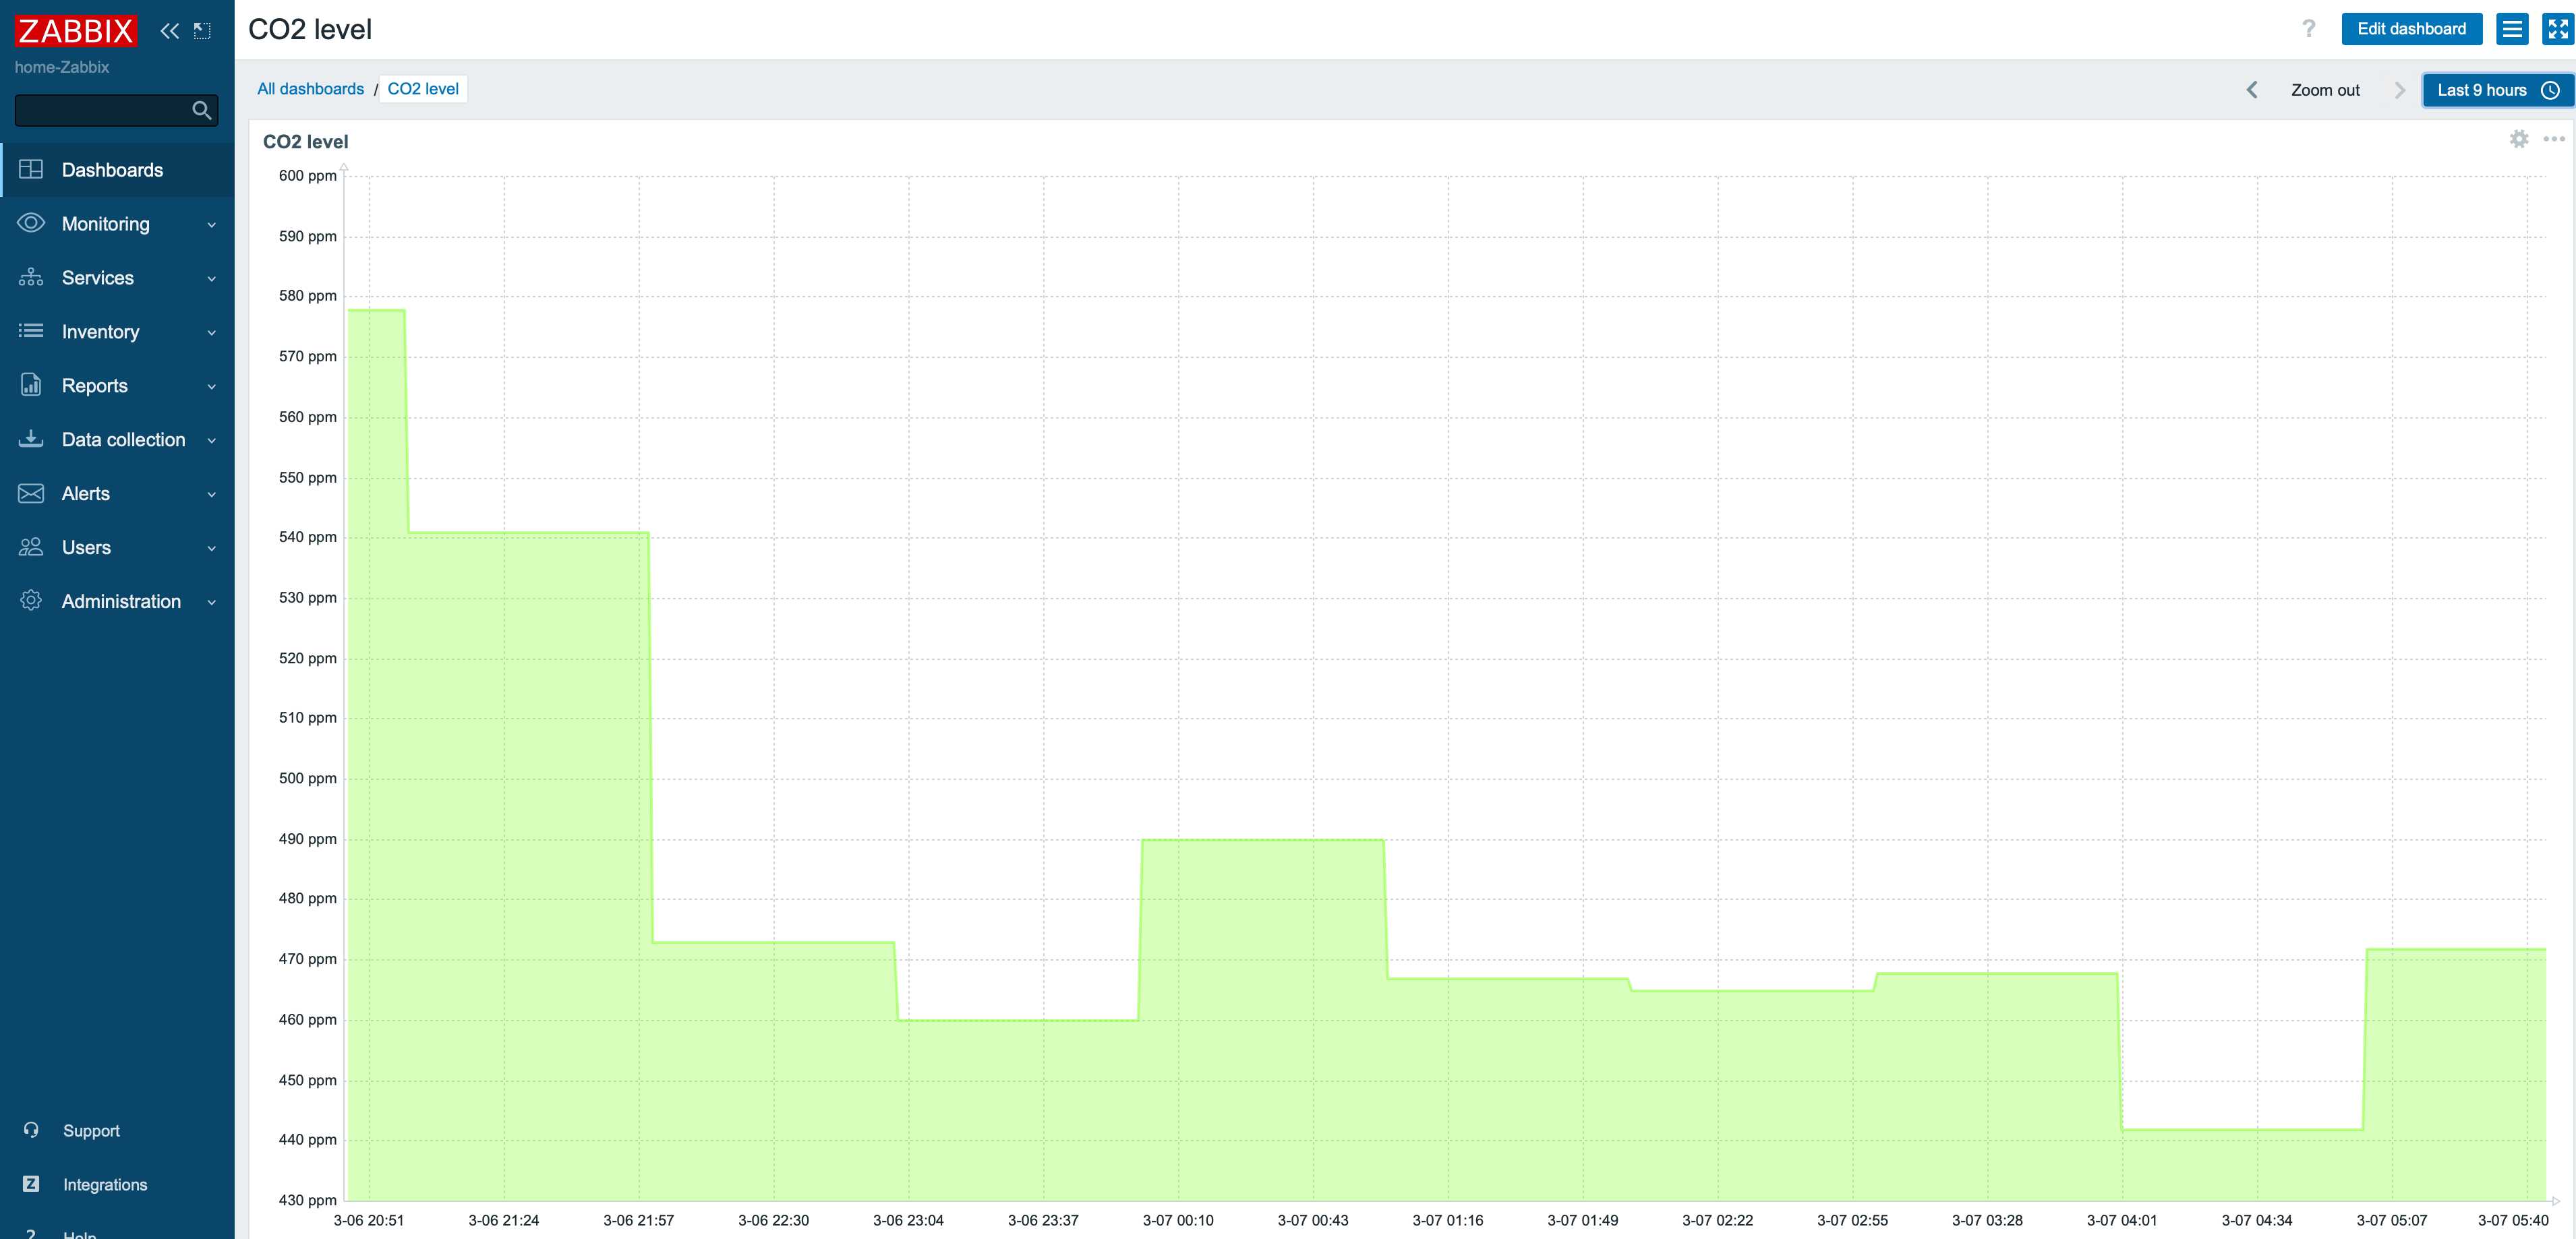
I also created a full-page dashboard for it:
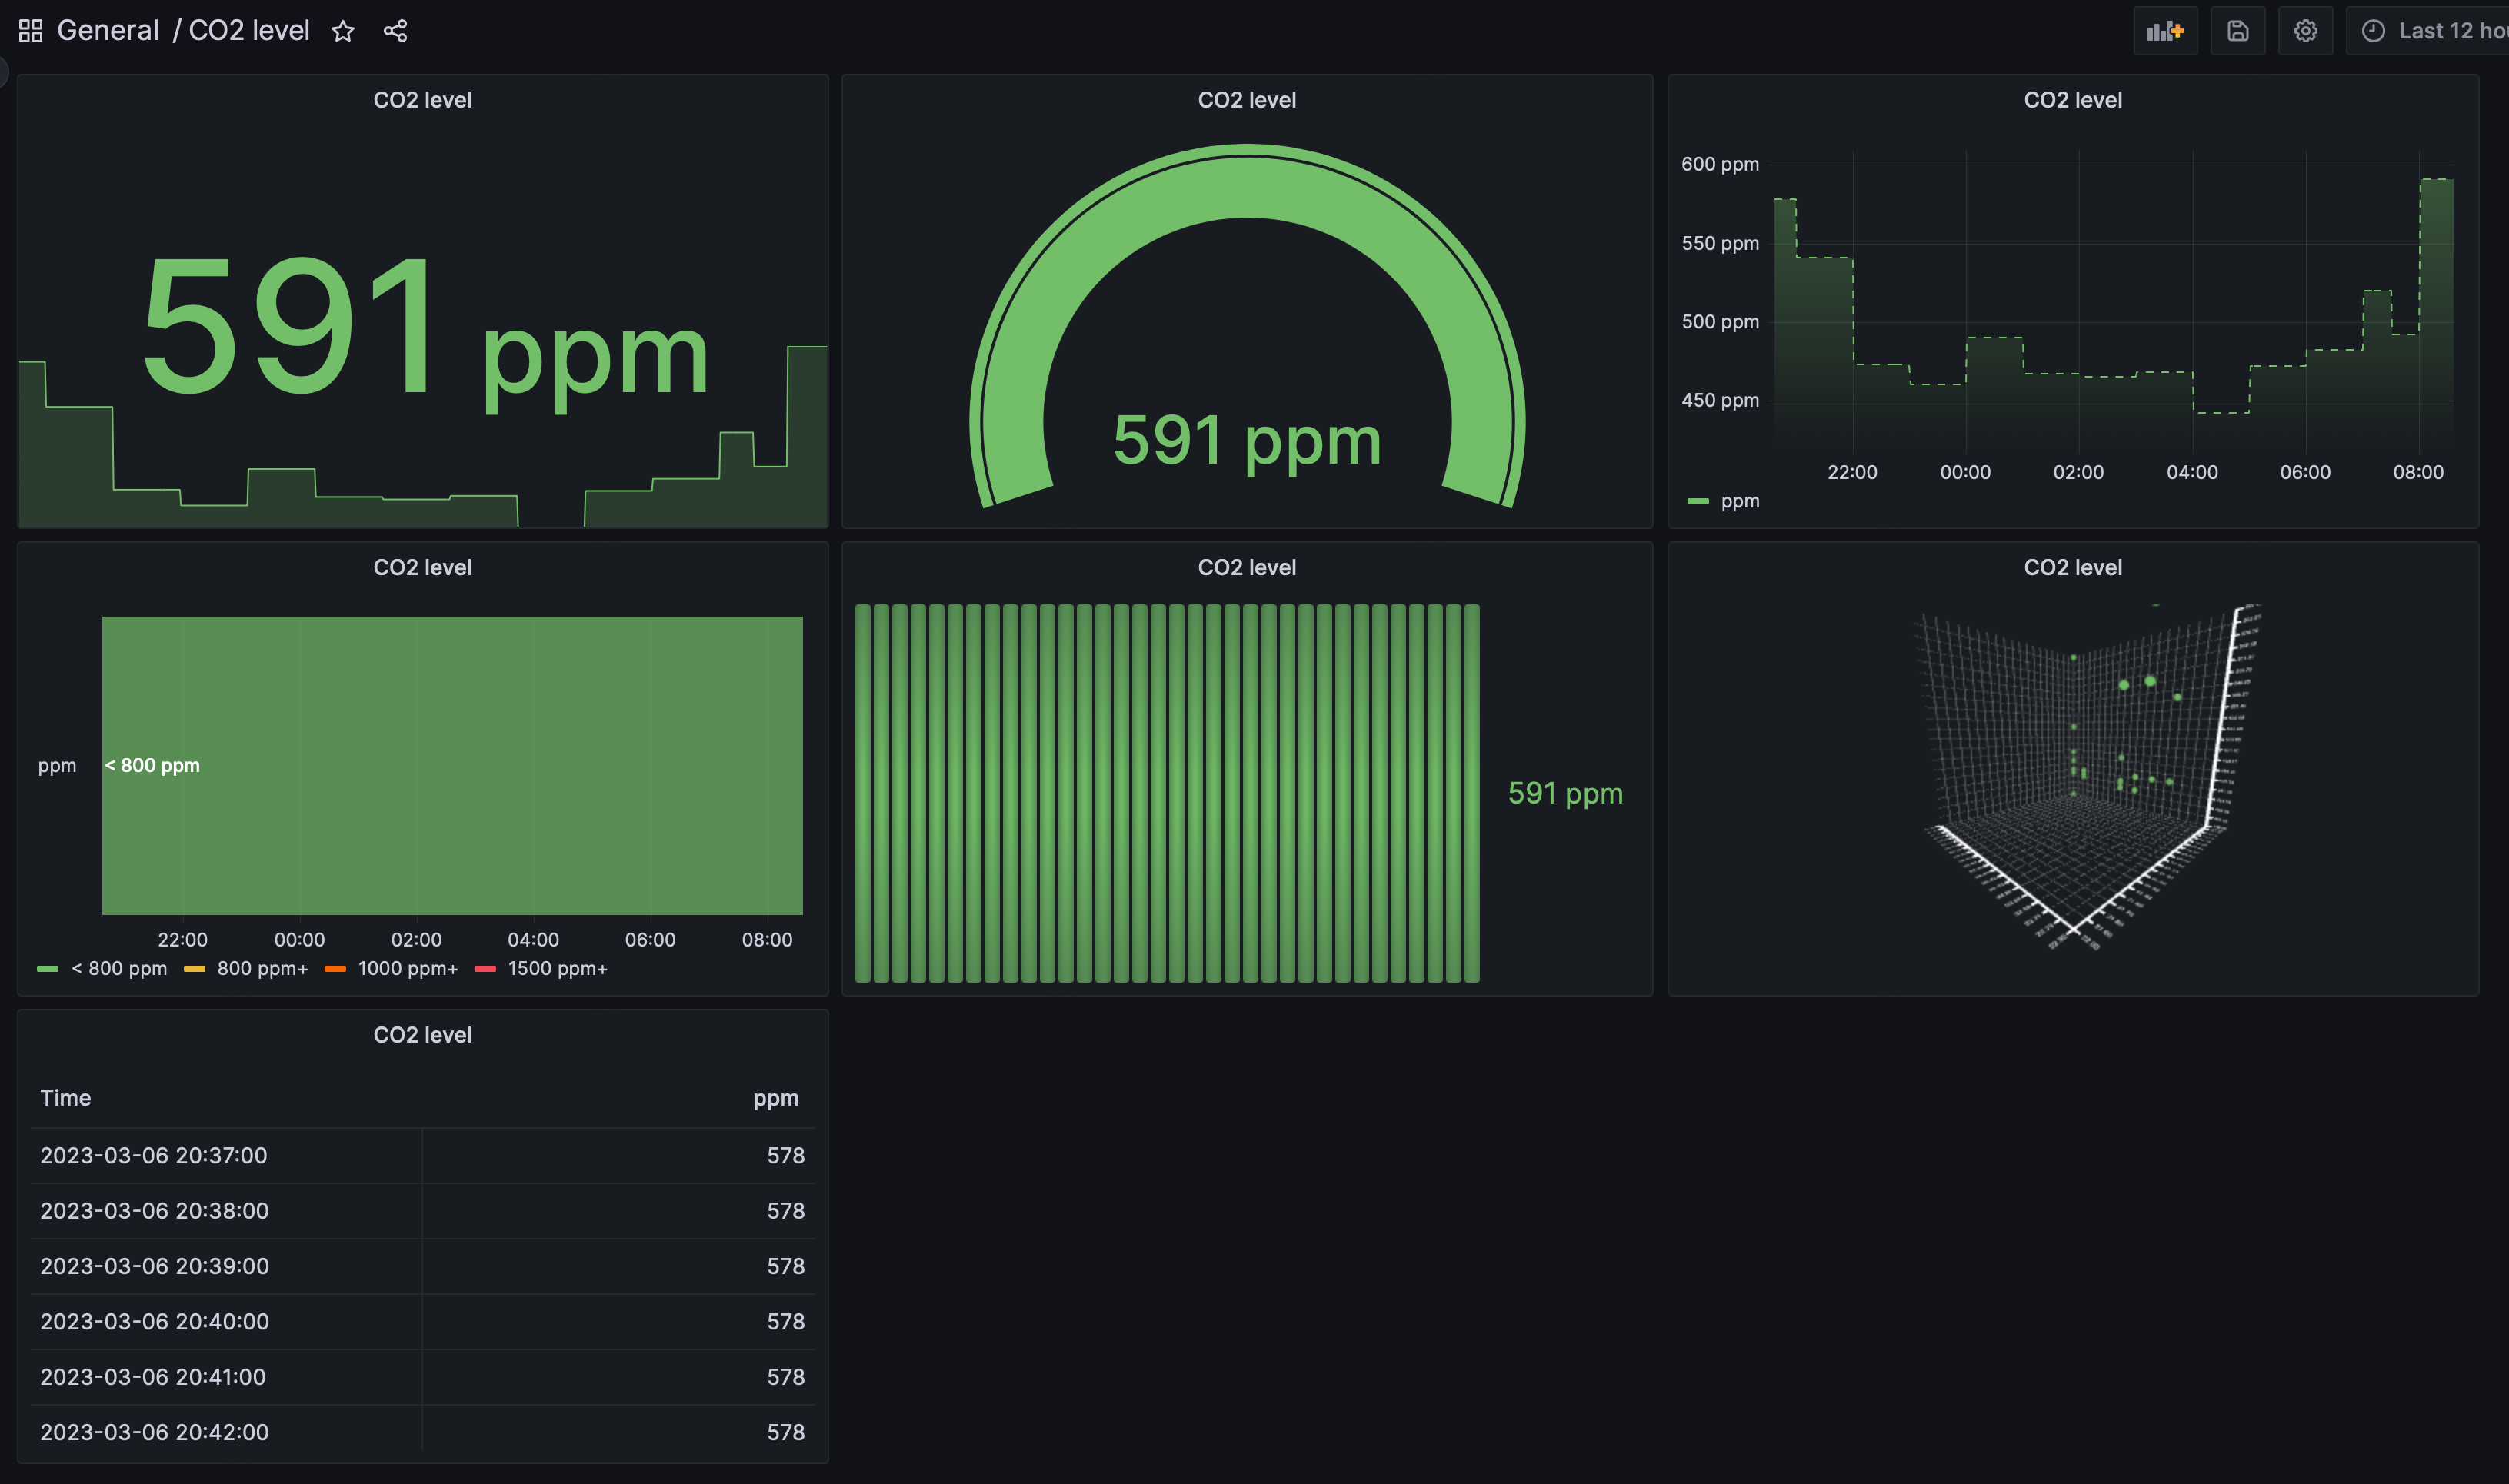
... and, to demonstrate Grafana's different panels, here's a Grafana dashboard showing the value with different kinds of panels.
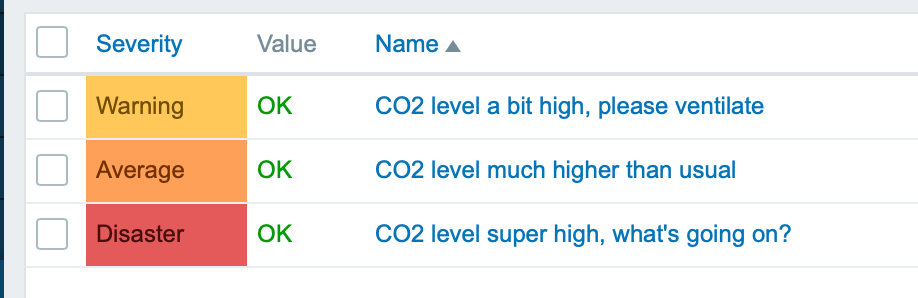
Alerting
I also added some alerting, so we'll get to know if the air quality is somehow bad even if we would not be at home. We just got our ventilation unit serviced so in theory the air in our house is very fresh. Now we'll see about that through Zabbix.
I have been working at Forcepoint since 2014 and writing this blog is always a breeze of a fresh air as I get to monitor the real world.
Add new comment